

[54]. The European Air Quality Directives focus
on regional air pollution.
In addition to the EMEP network, many countries also have monitoring networks that have
been established in urban areas to monitor roadside pollution levels, and urban background
levels. For example, the UK has an extensive air
quality
network,
across
the
country
(UK Automatic Urban and Rural Network,
AURN) and in the major urban areas, such as
London (London Air Quality Network, LAQN).
The UK AURN has over 100 monitoring stations
located across the country for NO x , PM 2.5 , PM 10 ,
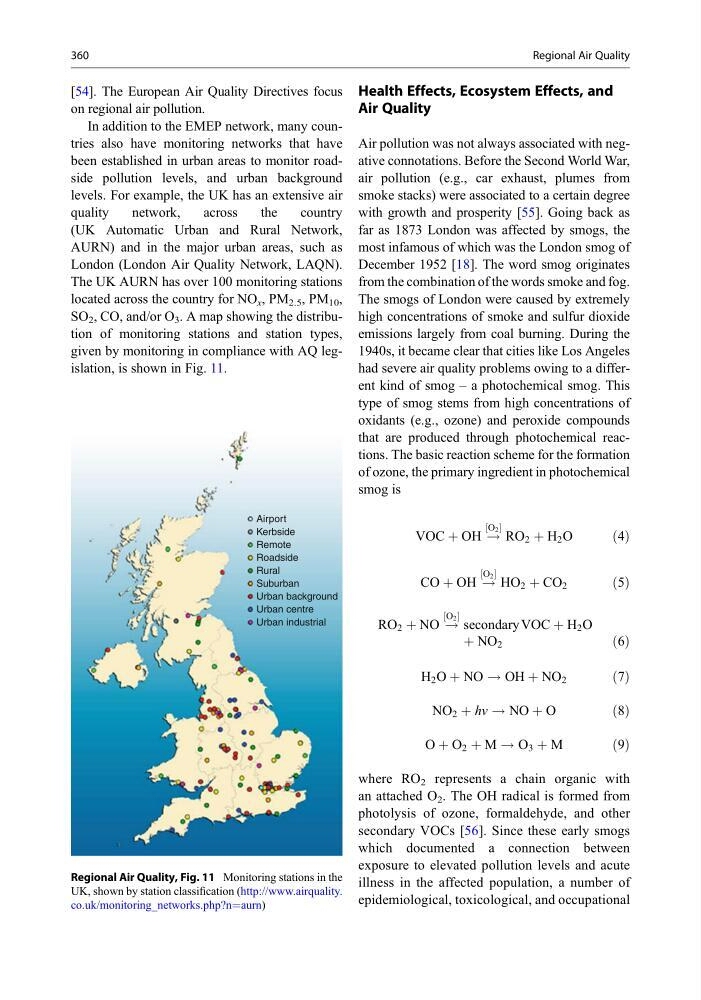
SO 2 , CO, and/or O 3 . A map showing the distribution of monitoring stations and station types,
given by monitoring in compliance with AQ legislation, is shown in Fig. 11.
Health Effects, Ecosystem Effects, and
Air Quality
Air pollution was not always associated with negative connotations. Before the Second World War,
air pollution (e.g., car exhaust, plumes from
smoke stacks) were associated to a certain degree
with growth and prosperity [55]. Going back as
far as 1873 London was affected by smogs, the
most infamous of which was the London smog of
December 1952 [18]. The word smog originates
from the combination of the words smoke and fog.
The smogs of London were caused by extremely
high concentrations of smoke and sulfur dioxide
emissions largely from coal burning. During the
1940s, it became clear that cities like Los Angeles
had severe air quality problems owing to a different kind of smog – a photochemical smog. This
type of smog stems from high concentrations of
oxidants (e.g., ozone) and peroxide compounds
that are produced through photochemical reactions. The basic reaction scheme for the formation
of ozone, the primary ingredient in photochemical
smog is
VOC þ OH !
O 2
½
RO 2 þ H 2 O
ð4Þ
CO þ OH !
O 2
½
HO 2 þ CO 2
ð5Þ
RO 2 þ NO !
O 2
½
secondary VOC þ H 2 O
þ NO 2
ð6Þ
H 2 O þ NO ! OH þ NO 2
ð7Þ
NO 2 þ hv ! NO þ O
ð8Þ
O þ O 2 þ M ! O 3 þ M
ð9Þ
where RO 2 represents a chain organic with
an attached O 2 . The OH radical is formed from
photolysis of ozone, formaldehyde, and other
secondary VOCs [56]. Since these early smogs
which documented a connection between
exposure to elevated pollution levels and acute
illness in the affected population, a number of
epidemiological, toxicological, and occupational
Airport
Kerbside
Remote
Roadside
Rural
Suburban
Urban background
Urban centre
Urban industrial
Regional Air Quality, Fig. 11 Monitoring stations in the
UK, shown by station classification (http://www.airquality.
co.uk/monitoring_networks.php?n¼aurn)
360
Regional Air Quality
on regional air pollution.
In addition to the EMEP network, many countries also have monitoring networks that have
been established in urban areas to monitor roadside pollution levels, and urban background
levels. For example, the UK has an extensive air
quality
network,
across
the
country
(UK Automatic Urban and Rural Network,
AURN) and in the major urban areas, such as
London (London Air Quality Network, LAQN).
The UK AURN has over 100 monitoring stations
located across the country for NO x , PM 2.5 , PM 10 ,
SO 2 , CO, and/or O 3 . A map showing the distribution of monitoring stations and station types,
given by monitoring in compliance with AQ legislation, is shown in Fig. 11.
Health Effects, Ecosystem Effects, and
Air Quality
Air pollution was not always associated with negative connotations. Before the Second World War,
air pollution (e.g., car exhaust, plumes from
smoke stacks) were associated to a certain degree
with growth and prosperity [55]. Going back as
far as 1873 London was affected by smogs, the
most infamous of which was the London smog of
December 1952 [18]. The word smog originates
from the combination of the words smoke and fog.
The smogs of London were caused by extremely
high concentrations of smoke and sulfur dioxide
emissions largely from coal burning. During the
1940s, it became clear that cities like Los Angeles
had severe air quality problems owing to a different kind of smog – a photochemical smog. This
type of smog stems from high concentrations of
oxidants (e.g., ozone) and peroxide compounds
that are produced through photochemical reactions. The basic reaction scheme for the formation
of ozone, the primary ingredient in photochemical
smog is
VOC þ OH !
O 2
½
RO 2 þ H 2 O
ð4Þ
CO þ OH !
O 2
½
HO 2 þ CO 2
ð5Þ
RO 2 þ NO !
O 2
½
secondary VOC þ H 2 O
þ NO 2
ð6Þ
H 2 O þ NO ! OH þ NO 2
ð7Þ
NO 2 þ hv ! NO þ O
ð8Þ
O þ O 2 þ M ! O 3 þ M
ð9Þ
where RO 2 represents a chain organic with
an attached O 2 . The OH radical is formed from
photolysis of ozone, formaldehyde, and other
secondary VOCs [56]. Since these early smogs
which documented a connection between
exposure to elevated pollution levels and acute
illness in the affected population, a number of
epidemiological, toxicological, and occupational
Airport
Kerbside
Remote
Roadside
Rural
Suburban
Urban background
Urban centre
Urban industrial
Regional Air Quality, Fig. 11 Monitoring stations in the
UK, shown by station classification (http://www.airquality.
co.uk/monitoring_networks.php?n¼aurn)
360
Regional Air Quality