

Ozone is currently a problematic regional air
quality issue for many locations. Ozone is formed
in the atmosphere from the photochemically
driven reactions of NO x , VOCs, and CO. The
atmospheric cycle of reactions that form ozone
are shown in Fig. 6, where RH represents the
VOCs/hydrocarbons. High levels of ozone can
be found in urban areas, as well as in rural areas.
Ozone is a secondary pollutant and takes time to
form in the atmosphere, during that time can be
transported away from the emission source. The
time necessary for ozone formation depends on
factors such as sunlight and the availability of the
precursor compounds, and is typically on the
order of hours. Modern day average background
O 3 mixing ratios in the Northern Hemisphere
range from 20 to 45 ppbV (~39–88 mg m
À3 ).
Background in this case is defined as the fraction
of ozone that is not attributed to anthropogenic
sources of local origin and is therefore resulting
from stratospheric ozone transport to the troposphere, ozone production from natural sources of
NO x and VOCs (e.g., lightning, biogenic emissions), or long-range transport of ozone from distant pollutant sources [27]. The contribution of
background ozone, specifically that from longterm transport, is a concern for many locations
that are in exceedance of air quality standards, as
the background contribution can make the difference between being in attainment and not. This is
of particular concern in the Western US where
influence from Asian emissions may be making
it more difficult to achieve current regulatory air
quality standards [28]. Many urban areas, beyond
those in the Western US, are often in exceedance
of their respective air quality standards for ozone,
0
0
1
2
3
4
80
60
40
20
0
Mon
Tue
Wed
Thu
Fri
Sat
Sun
3
6
9
12 15 18 21 24
h
0
3
6
140
80
60
40
20
120
100
80
60
40
20
9 12 15
18 21
24
h
ppb
μg/m 3
0
3
6
9
12 15 18 21 24
h
0
3
6
9
12 15 18 21 24
h
7
0
0
2
–
1
0
0
2
3
0
7
0
0
2
–
1
0
0
2
O
C
NOX
7
0
0
2
–
1
0
0
2
PM 10
7
0
0
2
–
1
0
0
2
ppm
ppb
Mon
Tue
Wed
Thu
Fri
Sat
Sun
Mon
Tue
Wed
Thu
Fri
Sat
Sun
Mon
Tue
Wed
Thu
Fri
Sat
Sun
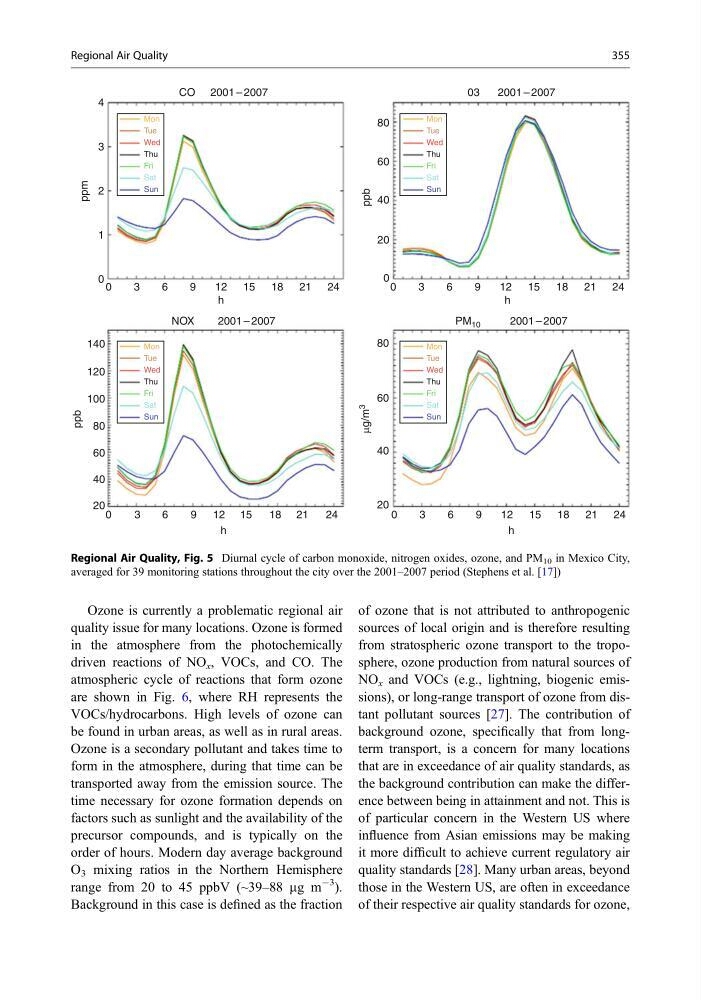
Regional Air Quality, Fig. 5 Diurnal cycle of carbon monoxide, nitrogen oxides, ozone, and PM 10 in Mexico City,
averaged for 39 monitoring stations throughout the city over the 2001–2007 period (Stephens et al. [17])
Regional Air Quality
355
quality issue for many locations. Ozone is formed
in the atmosphere from the photochemically
driven reactions of NO x , VOCs, and CO. The
atmospheric cycle of reactions that form ozone
are shown in Fig. 6, where RH represents the
VOCs/hydrocarbons. High levels of ozone can
be found in urban areas, as well as in rural areas.
Ozone is a secondary pollutant and takes time to
form in the atmosphere, during that time can be
transported away from the emission source. The
time necessary for ozone formation depends on
factors such as sunlight and the availability of the
precursor compounds, and is typically on the
order of hours. Modern day average background
O 3 mixing ratios in the Northern Hemisphere
range from 20 to 45 ppbV (~39–88 mg m
À3 ).
Background in this case is defined as the fraction
of ozone that is not attributed to anthropogenic
sources of local origin and is therefore resulting
from stratospheric ozone transport to the troposphere, ozone production from natural sources of
NO x and VOCs (e.g., lightning, biogenic emissions), or long-range transport of ozone from distant pollutant sources [27]. The contribution of
background ozone, specifically that from longterm transport, is a concern for many locations
that are in exceedance of air quality standards, as
the background contribution can make the difference between being in attainment and not. This is
of particular concern in the Western US where
influence from Asian emissions may be making
it more difficult to achieve current regulatory air
quality standards [28]. Many urban areas, beyond
those in the Western US, are often in exceedance
of their respective air quality standards for ozone,
0
0
1
2
3
4
80
60
40
20
0
Mon
Tue
Wed
Thu
Fri
Sat
Sun
3
6
9
12 15 18 21 24
h
0
3
6
140
80
60
40
20
120
100
80
60
40
20
9 12 15
18 21
24
h
ppb
μg/m 3
0
3
6
9
12 15 18 21 24
h
0
3
6
9
12 15 18 21 24
h
7
0
0
2
–
1
0
0
2
3
0
7
0
0
2
–
1
0
0
2
O
C
NOX
7
0
0
2
–
1
0
0
2
PM 10
7
0
0
2
–
1
0
0
2
ppm
ppb
Mon
Tue
Wed
Thu
Fri
Sat
Sun
Mon
Tue
Wed
Thu
Fri
Sat
Sun
Mon
Tue
Wed
Thu
Fri
Sat
Sun
Regional Air Quality, Fig. 5 Diurnal cycle of carbon monoxide, nitrogen oxides, ozone, and PM 10 in Mexico City,
averaged for 39 monitoring stations throughout the city over the 2001–2007 period (Stephens et al. [17])
Regional Air Quality
355