

forcing (When the balance between the radiative
energy received from the sun and radiative energy
leaving the Earth-atmosphere system is perturbed,
e.g., by a concentration change of an absorbing
gas, the resulting imbalance is termed radiative
forcing. It can be calculated by changing the concentration of the substance and keeping all other
parameters fixed. In the real climate system, the
imbalance stimulates climate change trying to
restore the energy balance of the planet.) (GWP)
and the net surface temperature change (GTP) of
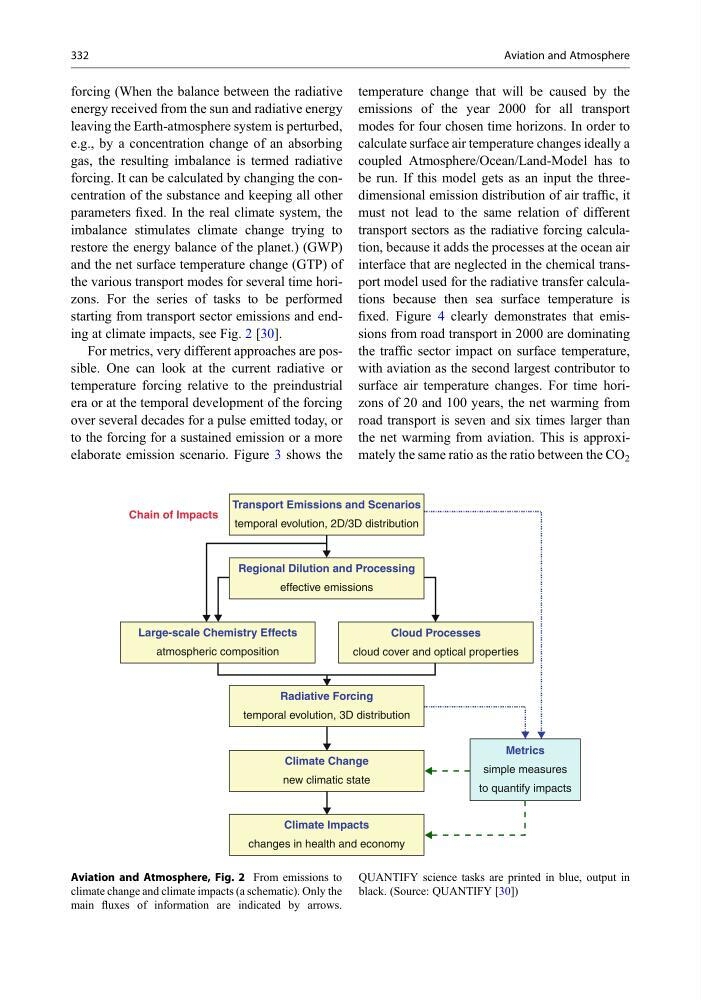
the various transport modes for several time horizons. For the series of tasks to be performed
starting from transport sector emissions and ending at climate impacts, see Fig. 2 [30].
For metrics, very different approaches are possible. One can look at the current radiative or
temperature forcing relative to the preindustrial
era or at the temporal development of the forcing
over several decades for a pulse emitted today, or
to the forcing for a sustained emission or a more
elaborate emission scenario. Figure 3 shows the
temperature change that will be caused by the
emissions of the year 2000 for all transport
modes for four chosen time horizons. In order to
calculate surface air temperature changes ideally a
coupled Atmosphere/Ocean/Land-Model has to
be run. If this model gets as an input the threedimensional emission distribution of air traffic, it
must not lead to the same relation of different
transport sectors as the radiative forcing calculation, because it adds the processes at the ocean air
interface that are neglected in the chemical transport model used for the radiative transfer calculations because then sea surface temperature is
fixed. Figure 4 clearly demonstrates that emissions from road transport in 2000 are dominating
the traffic sector impact on surface temperature,
with aviation as the second largest contributor to
surface air temperature changes. For time horizons of 20 and 100 years, the net warming from
road transport is seven and six times larger than
the net warming from aviation. This is approximately the same ratio as the ratio between the CO 2
Transport Emissions and Scenarios
temporal evolution, 2D/3D distribution
Chain of Impacts
Regional Dilution and Processing
effective emissions
Large-scale Chemistry Effects
atmospheric composition
Cloud Processes
cloud cover and optical properties
Radiative Forcing
temporal evolution, 3D distribution
Climate Change
new climatic state
Metrics
simple measures
to quantify impacts
Climate Impacts
changes in health and economy
Aviation and Atmosphere, Fig. 2 From emissions to
climate change and climate impacts (a schematic). Only the
main fluxes of information are indicated by arrows.
QUANTIFY science tasks are printed in blue, output in
black. (Source: QUANTIFY [30])
332
Aviation and Atmosphere
energy received from the sun and radiative energy
leaving the Earth-atmosphere system is perturbed,
e.g., by a concentration change of an absorbing
gas, the resulting imbalance is termed radiative
forcing. It can be calculated by changing the concentration of the substance and keeping all other
parameters fixed. In the real climate system, the
imbalance stimulates climate change trying to
restore the energy balance of the planet.) (GWP)
and the net surface temperature change (GTP) of
the various transport modes for several time horizons. For the series of tasks to be performed
starting from transport sector emissions and ending at climate impacts, see Fig. 2 [30].
For metrics, very different approaches are possible. One can look at the current radiative or
temperature forcing relative to the preindustrial
era or at the temporal development of the forcing
over several decades for a pulse emitted today, or
to the forcing for a sustained emission or a more
elaborate emission scenario. Figure 3 shows the
temperature change that will be caused by the
emissions of the year 2000 for all transport
modes for four chosen time horizons. In order to
calculate surface air temperature changes ideally a
coupled Atmosphere/Ocean/Land-Model has to
be run. If this model gets as an input the threedimensional emission distribution of air traffic, it
must not lead to the same relation of different
transport sectors as the radiative forcing calculation, because it adds the processes at the ocean air
interface that are neglected in the chemical transport model used for the radiative transfer calculations because then sea surface temperature is
fixed. Figure 4 clearly demonstrates that emissions from road transport in 2000 are dominating
the traffic sector impact on surface temperature,
with aviation as the second largest contributor to
surface air temperature changes. For time horizons of 20 and 100 years, the net warming from
road transport is seven and six times larger than
the net warming from aviation. This is approximately the same ratio as the ratio between the CO 2
Transport Emissions and Scenarios
temporal evolution, 2D/3D distribution
Chain of Impacts
Regional Dilution and Processing
effective emissions
Large-scale Chemistry Effects
atmospheric composition
Cloud Processes
cloud cover and optical properties
Radiative Forcing
temporal evolution, 3D distribution
Climate Change
new climatic state
Metrics
simple measures
to quantify impacts
Climate Impacts
changes in health and economy
Aviation and Atmosphere, Fig. 2 From emissions to
climate change and climate impacts (a schematic). Only the
main fluxes of information are indicated by arrows.
QUANTIFY science tasks are printed in blue, output in
black. (Source: QUANTIFY [30])
332
Aviation and Atmosphere