

approved a formal, official “golden spike” proposal
to define the Anthropocene epoch in the geologic
time scale. Final approval awaits a decision by the
International Geological Congress [16].
Observations of Climate Change
There are many direct methods of observing climate change, for example, records of temperature and rainfall, tide gauges, and satellite
observations, including observations of land use
change and sea surface temperature. The observational record is extended by analyzing the
world around us. For example, tree growth
rings contain information on growing conditions; stalactites, corals, and sediments have similar annual growth layers with compositions
which can be analyzed to yield climate data.
A wealth of information concerning past climate
and atmospheric composition has been obtained
by analyzing the composition of annual ice accumulation layers, obtained by boring into the glaciers of Greenland and Antarctica.
Surface Temperature
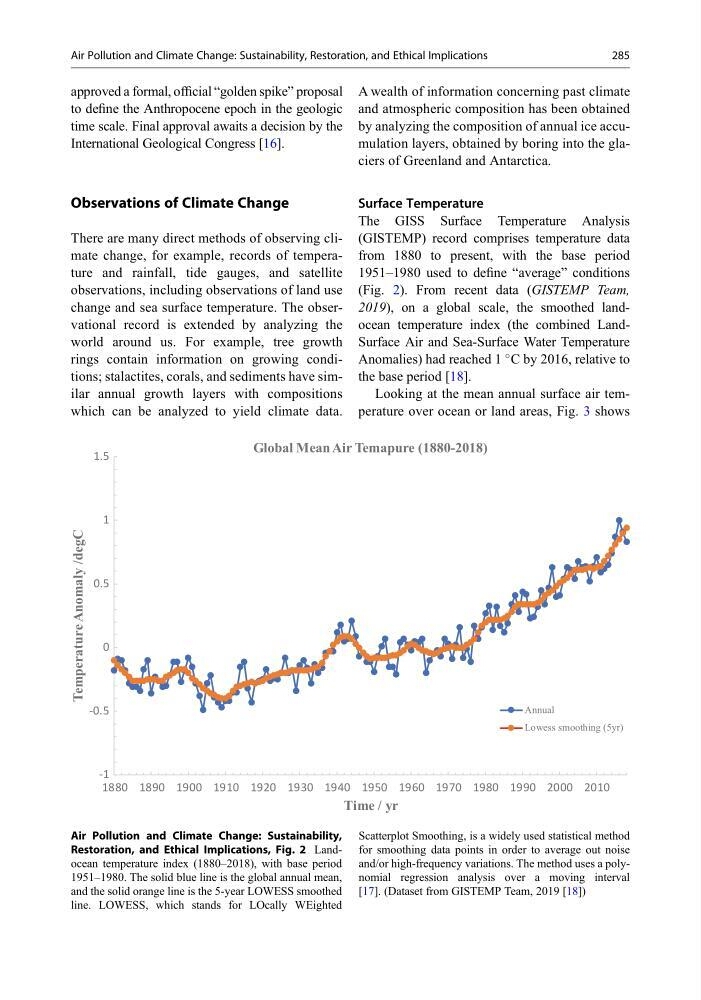
The GISS Surface Temperature Analysis
(GISTEMP) record comprises temperature data
from 1880 to present, with the base period
1951–1980 used to define “average” conditions
(Fig. 2). From recent data (GISTEMP Team,
2019), on a global scale, the smoothed landocean temperature index (the combined LandSurface Air and Sea-Surface Water Temperature
Anomalies) had reached 1
C by 2016, relative to
the base period [18].
Looking at the mean annual surface air temperature over ocean or land areas, Fig. 3 shows
-1
-0.5
0
0.5
1
1.5
1880 1890 1900 1910 1920 1930 1940 1950 1960 1970 1980 1990 2000 2010
Temperature Anomaly /degC
Time / yr
Global Mean Air Temapure (1880-2018)
Annual
Lowess smoothing (5yr)
Air Pollution and Climate Change: Sustainability,
Restoration, and Ethical Implications, Fig. 2 Landocean temperature index (1880–2018), with base period
1951–1980. The solid blue line is the global annual mean,
and the solid orange line is the 5-year LOWESS smoothed
line. LOWESS, which stands for LOcally WEighted
Scatterplot Smoothing, is a widely used statistical method
for smoothing data points in order to average out noise
and/or high-frequency variations. The method uses a polynomial regression analysis over a moving interval
[17]. (Dataset from GISTEMP Team, 2019 [18])
Air Pollution and Climate Change: Sustainability, Restoration, and Ethical Implications
285
to define the Anthropocene epoch in the geologic
time scale. Final approval awaits a decision by the
International Geological Congress [16].
Observations of Climate Change
There are many direct methods of observing climate change, for example, records of temperature and rainfall, tide gauges, and satellite
observations, including observations of land use
change and sea surface temperature. The observational record is extended by analyzing the
world around us. For example, tree growth
rings contain information on growing conditions; stalactites, corals, and sediments have similar annual growth layers with compositions
which can be analyzed to yield climate data.
A wealth of information concerning past climate
and atmospheric composition has been obtained
by analyzing the composition of annual ice accumulation layers, obtained by boring into the glaciers of Greenland and Antarctica.
Surface Temperature
The GISS Surface Temperature Analysis
(GISTEMP) record comprises temperature data
from 1880 to present, with the base period
1951–1980 used to define “average” conditions
(Fig. 2). From recent data (GISTEMP Team,
2019), on a global scale, the smoothed landocean temperature index (the combined LandSurface Air and Sea-Surface Water Temperature
Anomalies) had reached 1
C by 2016, relative to
the base period [18].
Looking at the mean annual surface air temperature over ocean or land areas, Fig. 3 shows
-1
-0.5
0
0.5
1
1.5
1880 1890 1900 1910 1920 1930 1940 1950 1960 1970 1980 1990 2000 2010
Temperature Anomaly /degC
Time / yr
Global Mean Air Temapure (1880-2018)
Annual
Lowess smoothing (5yr)
Air Pollution and Climate Change: Sustainability,
Restoration, and Ethical Implications, Fig. 2 Landocean temperature index (1880–2018), with base period
1951–1980. The solid blue line is the global annual mean,
and the solid orange line is the 5-year LOWESS smoothed
line. LOWESS, which stands for LOcally WEighted
Scatterplot Smoothing, is a widely used statistical method
for smoothing data points in order to average out noise
and/or high-frequency variations. The method uses a polynomial regression analysis over a moving interval
[17]. (Dataset from GISTEMP Team, 2019 [18])
Air Pollution and Climate Change: Sustainability, Restoration, and Ethical Implications
285