

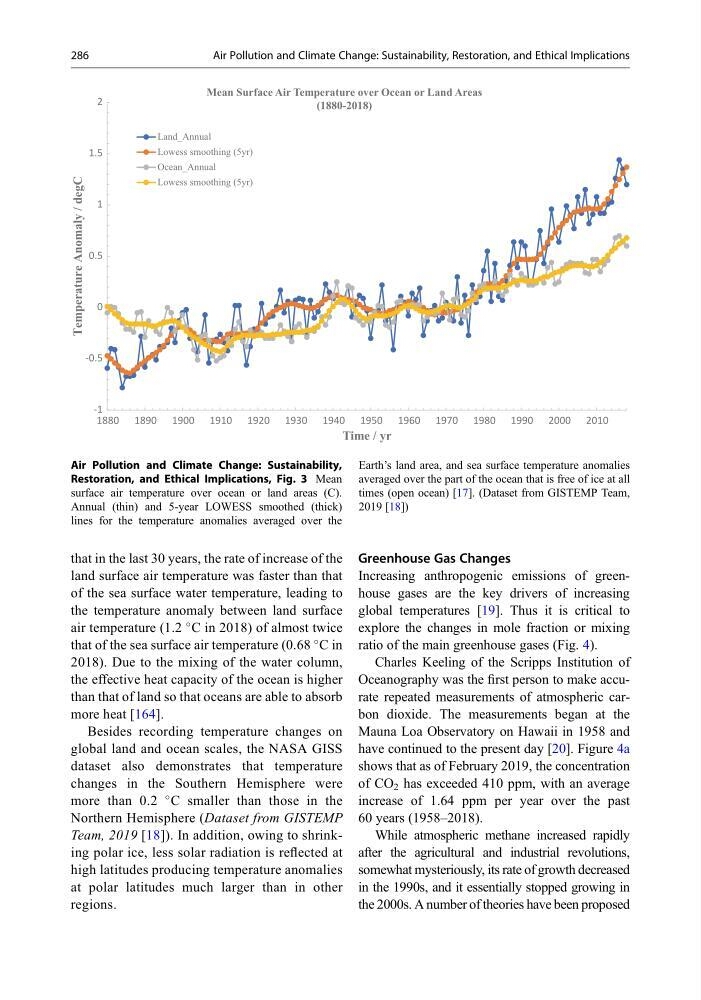
that in the last 30 years, the rate of increase of the
land surface air temperature was faster than that
of the sea surface water temperature, leading to
the temperature anomaly between land surface
air temperature (1.2
C in 2018) of almost twice
that of the sea surface air temperature (0.68
C in
2018). Due to the mixing of the water column,
the effective heat capacity of the ocean is higher
than that of land so that oceans are able to absorb
more heat [164].
Besides recording temperature changes on
global land and ocean scales, the NASA GISS
dataset also demonstrates that temperature
changes in the Southern Hemisphere were
more than 0.2
C smaller than those in the
Northern Hemisphere (Dataset from GISTEMP
Team, 2019 [18]). In addition, owing to shrinking polar ice, less solar radiation is reflected at
high latitudes producing temperature anomalies
at polar latitudes much larger than in other
regions.
Greenhouse Gas Changes
Increasing anthropogenic emissions of greenhouse gases are the key drivers of increasing
global temperatures [19]. Thus it is critical to
explore the changes in mole fraction or mixing
ratio of the main greenhouse gases (Fig. 4).
Charles Keeling of the Scripps Institution of
Oceanography was the first person to make accurate repeated measurements of atmospheric carbon dioxide. The measurements began at the
Mauna Loa Observatory on Hawaii in 1958 and
have continued to the present day [20]. Figure 4a
shows that as of February 2019, the concentration
of CO 2 has exceeded 410 ppm, with an average
increase of 1.64 ppm per year over the past
60 years (1958–2018).
While atmospheric methane increased rapidly
after the agricultural and industrial revolutions,
somewhat mysteriously, its rate of growth decreased
in the 1990s, and it essentially stopped growing in
the 2000s. A number of theories have been proposed
-1
-0.5
0
0.5
1
1.5
2
1880 1890 1900 1910 1920 1930 1940 1950 1960 1970 1980 1990 2000 2010
Temperature Anomaly / degC
Time / yr
Mean Surface Air Temperature over Ocean or Land Areas
(1880-2018)
Land_Annual
Lowess smoothing (5yr)
Ocean_Annual
Lowess smoothing (5yr)
Air Pollution and Climate Change: Sustainability,
Restoration, and Ethical Implications, Fig. 3 Mean
surface air temperature over ocean or land areas (C).
Annual (thin) and 5-year LOWESS smoothed (thick)
lines for the temperature anomalies averaged over the
Earth’s land area, and sea surface temperature anomalies
averaged over the part of the ocean that is free of ice at all
times (open ocean) [17]. (Dataset from GISTEMP Team,
2019 [18])
286
Air Pollution and Climate Change: Sustainability, Restoration, and Ethical Implications
land surface air temperature was faster than that
of the sea surface water temperature, leading to
the temperature anomaly between land surface
air temperature (1.2
C in 2018) of almost twice
that of the sea surface air temperature (0.68
C in
2018). Due to the mixing of the water column,
the effective heat capacity of the ocean is higher
than that of land so that oceans are able to absorb
more heat [164].
Besides recording temperature changes on
global land and ocean scales, the NASA GISS
dataset also demonstrates that temperature
changes in the Southern Hemisphere were
more than 0.2
C smaller than those in the
Northern Hemisphere (Dataset from GISTEMP
Team, 2019 [18]). In addition, owing to shrinking polar ice, less solar radiation is reflected at
high latitudes producing temperature anomalies
at polar latitudes much larger than in other
regions.
Greenhouse Gas Changes
Increasing anthropogenic emissions of greenhouse gases are the key drivers of increasing
global temperatures [19]. Thus it is critical to
explore the changes in mole fraction or mixing
ratio of the main greenhouse gases (Fig. 4).
Charles Keeling of the Scripps Institution of
Oceanography was the first person to make accurate repeated measurements of atmospheric carbon dioxide. The measurements began at the
Mauna Loa Observatory on Hawaii in 1958 and
have continued to the present day [20]. Figure 4a
shows that as of February 2019, the concentration
of CO 2 has exceeded 410 ppm, with an average
increase of 1.64 ppm per year over the past
60 years (1958–2018).
While atmospheric methane increased rapidly
after the agricultural and industrial revolutions,
somewhat mysteriously, its rate of growth decreased
in the 1990s, and it essentially stopped growing in
the 2000s. A number of theories have been proposed
-1
-0.5
0
0.5
1
1.5
2
1880 1890 1900 1910 1920 1930 1940 1950 1960 1970 1980 1990 2000 2010
Temperature Anomaly / degC
Time / yr
Mean Surface Air Temperature over Ocean or Land Areas
(1880-2018)
Land_Annual
Lowess smoothing (5yr)
Ocean_Annual
Lowess smoothing (5yr)
Air Pollution and Climate Change: Sustainability,
Restoration, and Ethical Implications, Fig. 3 Mean
surface air temperature over ocean or land areas (C).
Annual (thin) and 5-year LOWESS smoothed (thick)
lines for the temperature anomalies averaged over the
Earth’s land area, and sea surface temperature anomalies
averaged over the part of the ocean that is free of ice at all
times (open ocean) [17]. (Dataset from GISTEMP Team,
2019 [18])
286
Air Pollution and Climate Change: Sustainability, Restoration, and Ethical Implications