

buildings/roofs, and impervious surface feature
types such as grass, trees (vegetation), etc. and
finally a surface type named other which can
correspond to different types of pavement. Buildings and roads are considered impervious and do
thereby generate runoff. Vegetation is considered
not to generate any runoff. From observations and
assumptions based on these, a simple calculation
is made to calculate an average percent imperviousness (PIMP) for a sub-catchment.
PIMP ¼ road_area à 100% þ building_area à 100% þ vegetation_area à 0%other_area à 0%
ð
Þ
=total area of sub À catchement
(1)
In the study [18] the strengths and weaknesses
of using a remote sensing technique to calculate
the percent imperviousness are investigated.
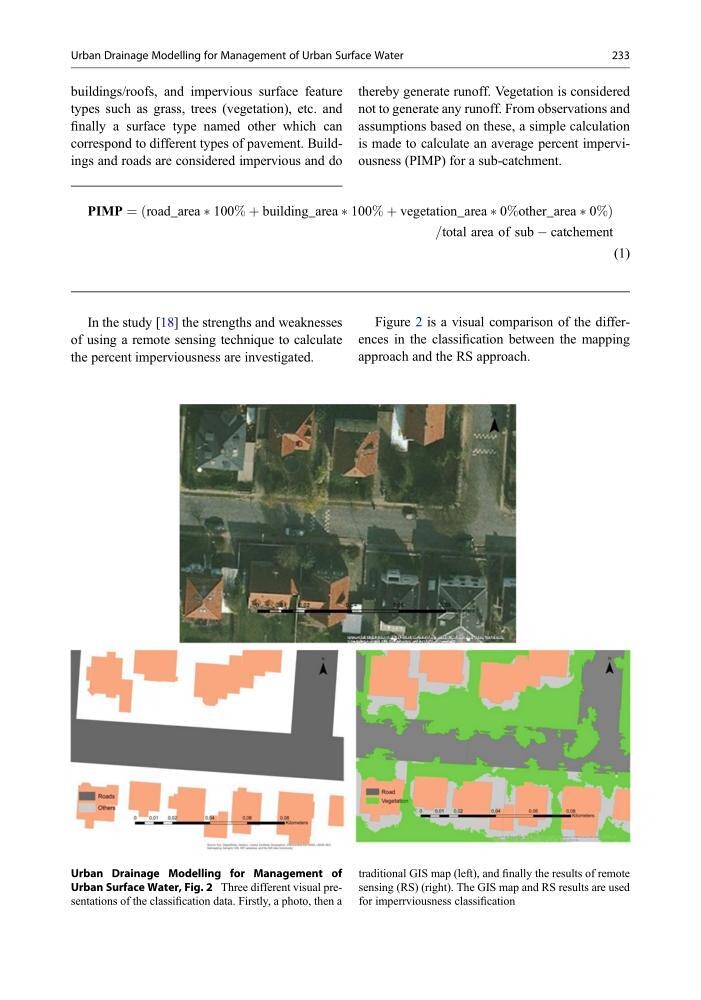
Figure 2 is a visual comparison of the differences in the classification between the mapping
approach and the RS approach.
Urban Drainage Modelling for Management of
Urban Surface Water, Fig. 2 Three different visual presentations of the classification data. Firstly, a photo, then a
traditional GIS map (left), and finally the results of remote
sensing (RS) (right). The GIS map and RS results are used
for imperrviousness classification
Urban Drainage Modelling for Management of Urban Surface Water
233
types such as grass, trees (vegetation), etc. and
finally a surface type named other which can
correspond to different types of pavement. Buildings and roads are considered impervious and do
thereby generate runoff. Vegetation is considered
not to generate any runoff. From observations and
assumptions based on these, a simple calculation
is made to calculate an average percent imperviousness (PIMP) for a sub-catchment.
PIMP ¼ road_area à 100% þ building_area à 100% þ vegetation_area à 0%other_area à 0%
ð
Þ
=total area of sub À catchement
(1)
In the study [18] the strengths and weaknesses
of using a remote sensing technique to calculate
the percent imperviousness are investigated.
Figure 2 is a visual comparison of the differences in the classification between the mapping
approach and the RS approach.
Urban Drainage Modelling for Management of
Urban Surface Water, Fig. 2 Three different visual presentations of the classification data. Firstly, a photo, then a
traditional GIS map (left), and finally the results of remote
sensing (RS) (right). The GIS map and RS results are used
for imperrviousness classification
Urban Drainage Modelling for Management of Urban Surface Water
233