

(although strictly speaking sulfuric acid is formed
within the atmosphere following the release of sulfur dioxide). Subsequent legislation, mandating the
use of tall chimneys to aid dispersion, use of lowsulfur and smokeless fuels in populated areas, the
migration of heavy industry away from cities and
the introduction of emissions control technologies
and policies (including emissions trading schemes
on the case of SO 2 ), have greatly reduced these
pollution phenomena in many nations. Over the
past 50 years, motor vehicle emissions have come
to dominate urban atmospheric composition in most
developed nations, as the global vehicle fleet has
increased by an order of magnitude over this
timeframe.
In developing nations, combustion of biofuels
(primarily wood) and coal for domestic cooking
and heating remain major urban pollutant sources.
Alongside the reduction in some of the traditional
primary pollutants (sulfur dioxide, carbon monoxide), levels of secondary components formed in the
atmosphere, such as ozone and (much of) nitrogen
dioxide and particulate matter, have in many cases
been rising, and have become the focus of concern.
Meteorology, Dynamics, and Mixing
The urban atmosphere may be defined horizontally by the extent of the particular city in question
(see comments below regarding export of urban
atmospheric pollutants), and vertically as
encompassing the boundary layer, the first few
100 m to kilometer or so of the atmosphere,
which is regarded as well mixed. The urban
boundary layer height determines the size of the
atmospheric compartment into which emissions
are mixed – a lower boundary layer height
(as commonly found at night) results in higher
concentrations for an equivalent emission
strength, all other things being equal. The urban
boundary layer may be further divided into vertical regions determined by the interaction between
the city topography and airflow: At the street
scale, urban canyons, formed between rows of
buildings, represent semi-isolated environments
into which traffic-related emissions are initially
discharged. The urban canopy layer encompasses
multiple street canyons at rooftop level. Above the
canopy layer, the overlying boundary layer is
sometimes divided into the roughness sub-layer,
where building wake-induced turbulence effects
predominate and atmospheric composition (as far
as it relates to urban emissions) is highly variable,
and the higher inertial sub-layer which exhibits a
more homogeneous composition [5].
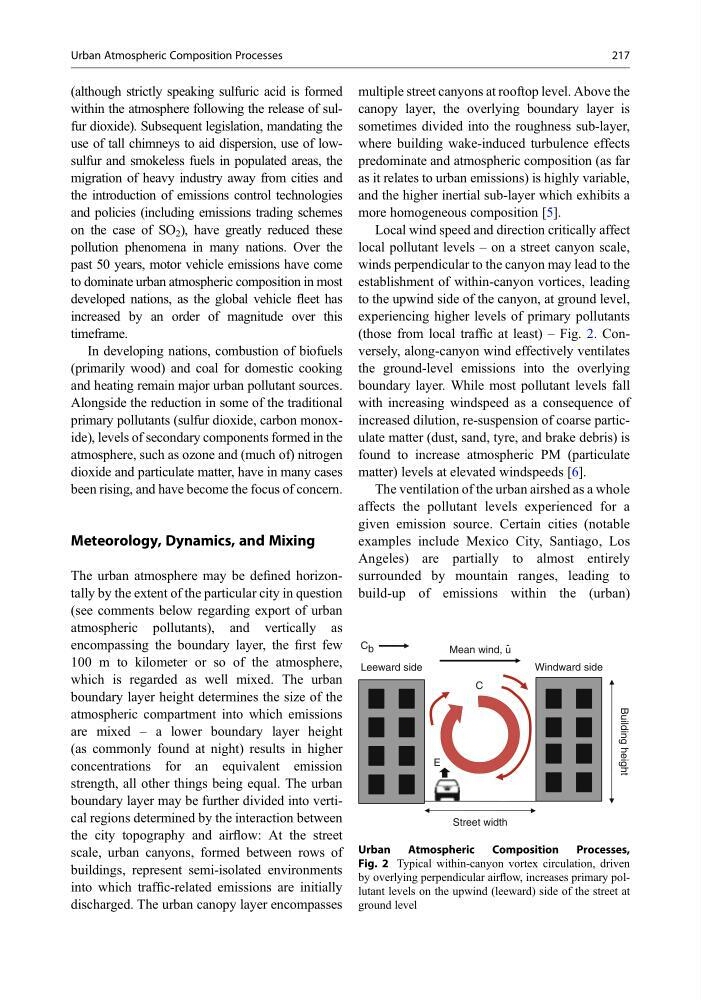
Local wind speed and direction critically affect
local pollutant levels – on a street canyon scale,
winds perpendicular to the canyon may lead to the
establishment of within-canyon vortices, leading
to the upwind side of the canyon, at ground level,
experiencing higher levels of primary pollutants
(those from local traffic at least) – Fig. 2. Conversely, along-canyon wind effectively ventilates
the ground-level emissions into the overlying
boundary layer. While most pollutant levels fall
with increasing windspeed as a consequence of
increased dilution, re-suspension of coarse particulate matter (dust, sand, tyre, and brake debris) is
found to increase atmospheric PM (particulate
matter) levels at elevated windspeeds [6].
The ventilation of the urban airshed as a whole
affects the pollutant levels experienced for a
given emission source. Certain cities (notable
examples include Mexico City, Santiago, Los
Angeles) are partially to almost entirely
surrounded by mountain ranges, leading to
build-up of emissions within the (urban)
Mean wind, u -
C b
Leeward side
Windward side
E
C
Street width
Building height
Urban Atmospheric
Composition Processes,
Fig. 2 Typical within-canyon vortex circulation, driven
by overlying perpendicular airflow, increases primary pollutant levels on the upwind (leeward) side of the street at
ground level
Urban Atmospheric Composition Processes
217
within the atmosphere following the release of sulfur dioxide). Subsequent legislation, mandating the
use of tall chimneys to aid dispersion, use of lowsulfur and smokeless fuels in populated areas, the
migration of heavy industry away from cities and
the introduction of emissions control technologies
and policies (including emissions trading schemes
on the case of SO 2 ), have greatly reduced these
pollution phenomena in many nations. Over the
past 50 years, motor vehicle emissions have come
to dominate urban atmospheric composition in most
developed nations, as the global vehicle fleet has
increased by an order of magnitude over this
timeframe.
In developing nations, combustion of biofuels
(primarily wood) and coal for domestic cooking
and heating remain major urban pollutant sources.
Alongside the reduction in some of the traditional
primary pollutants (sulfur dioxide, carbon monoxide), levels of secondary components formed in the
atmosphere, such as ozone and (much of) nitrogen
dioxide and particulate matter, have in many cases
been rising, and have become the focus of concern.
Meteorology, Dynamics, and Mixing
The urban atmosphere may be defined horizontally by the extent of the particular city in question
(see comments below regarding export of urban
atmospheric pollutants), and vertically as
encompassing the boundary layer, the first few
100 m to kilometer or so of the atmosphere,
which is regarded as well mixed. The urban
boundary layer height determines the size of the
atmospheric compartment into which emissions
are mixed – a lower boundary layer height
(as commonly found at night) results in higher
concentrations for an equivalent emission
strength, all other things being equal. The urban
boundary layer may be further divided into vertical regions determined by the interaction between
the city topography and airflow: At the street
scale, urban canyons, formed between rows of
buildings, represent semi-isolated environments
into which traffic-related emissions are initially
discharged. The urban canopy layer encompasses
multiple street canyons at rooftop level. Above the
canopy layer, the overlying boundary layer is
sometimes divided into the roughness sub-layer,
where building wake-induced turbulence effects
predominate and atmospheric composition (as far
as it relates to urban emissions) is highly variable,
and the higher inertial sub-layer which exhibits a
more homogeneous composition [5].
Local wind speed and direction critically affect
local pollutant levels – on a street canyon scale,
winds perpendicular to the canyon may lead to the
establishment of within-canyon vortices, leading
to the upwind side of the canyon, at ground level,
experiencing higher levels of primary pollutants
(those from local traffic at least) – Fig. 2. Conversely, along-canyon wind effectively ventilates
the ground-level emissions into the overlying
boundary layer. While most pollutant levels fall
with increasing windspeed as a consequence of
increased dilution, re-suspension of coarse particulate matter (dust, sand, tyre, and brake debris) is
found to increase atmospheric PM (particulate
matter) levels at elevated windspeeds [6].
The ventilation of the urban airshed as a whole
affects the pollutant levels experienced for a
given emission source. Certain cities (notable
examples include Mexico City, Santiago, Los
Angeles) are partially to almost entirely
surrounded by mountain ranges, leading to
build-up of emissions within the (urban)
Mean wind, u -
C b
Leeward side
Windward side
E
C
Street width
Building height
Urban Atmospheric
Composition Processes,
Fig. 2 Typical within-canyon vortex circulation, driven
by overlying perpendicular airflow, increases primary pollutant levels on the upwind (leeward) side of the street at
ground level
Urban Atmospheric Composition Processes
217