

Results highlight the potential of the approach
based on the parameterization of one-dimensional
wind and diffusivity profiles in terms of routinely
available meteorological parameters and morphological parameters such as l p and l f , which synthesize the main geometric characteristics of the
urban canopy.
Complex Urban Junction
The geometry of idealized building arrays is far
less complicated than the morphology of real
urban areas, where urban neighborhoods are
characterized by street intersections, asymmetric
street canyons, and staggered arrays of buildings
of irregular and/or highly variable shapes. These
local features significantly alter the flow and
dispersion patterns, as experimental and numerical
studies have concluded (see for example [32, 84,
85]). Reported here are some results of a modelling
study performed with a CFD code by employing
the RSM [86], and the advection-diffusion scheme
in a neighborhood in the city of Bari in southern
Italy. The real geometry comprises both step-up
and step-down street canyons and consists of two
asymmetric streets as shown in Fig. 9a. The
wider street canyon is characterized by an average aspect ratio W/H ~ 1.8 and it is perpendicular
to the wind direction. The other street canyon is
characterized by an average aspect ratio W/
H ~ 0.5 and is parallel to the wind direction.
The tallest building is ~ 46 m. The two canyons
intersect orthogonally forming four major blocks
of buildings and a junction. For the sake of computational convenience the real geometry was
slightly simplified, yet maintaining the main geometrical details of the street canyons. A fine
mesh close to the ground (up to a height of 4 m)
was used (Fig. 9b), with cell dimensions
δx min ¼ δy min ¼ 1 m, δz min ¼ 0.3 m. The number
of computational cells was approximately three
and a half million. Vectors of velocity magnitude
(m/s) and turbulent kinetic energy (m
2 /s
2 ) at
20
15
10
20
15
10
20
15
10
20
15
10
20
15
10
20
15
10
10
20
30
10
20
30
10
20
30
10
20
30
10
20
30
10
20
30
x/H
y/H
z=0.05H
z=H
z=2H
l
e
d
o
m
t
s
a
F
D
F
C
1.5
1
0.5
0.05
0.01
0.005
0
0.25
0.125
g/m3
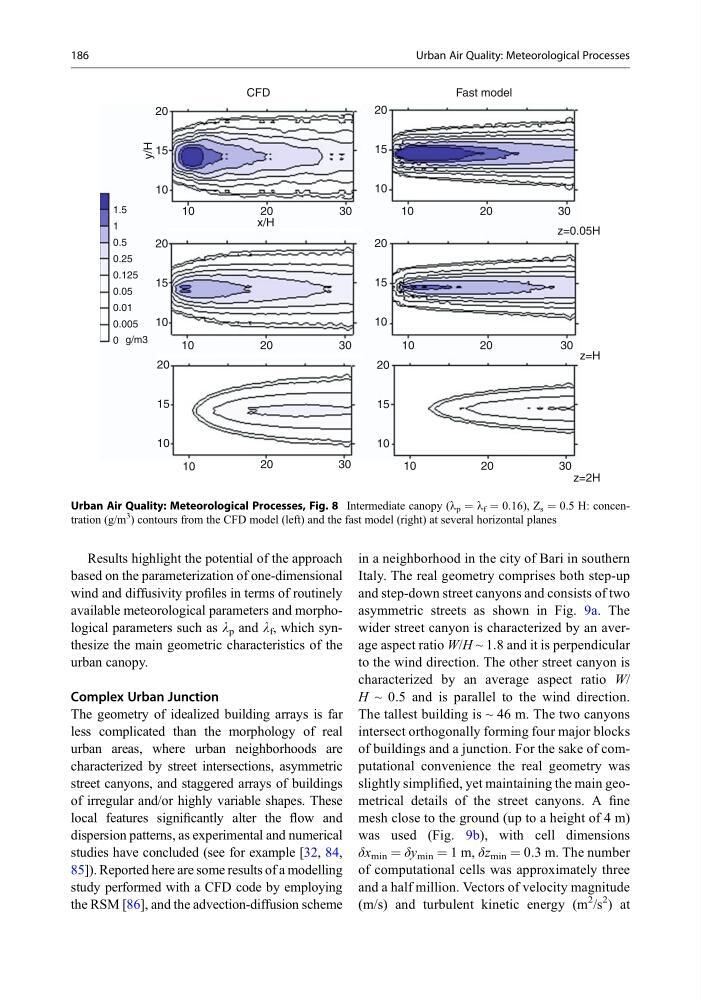
Urban Air Quality: Meteorological Processes, Fig. 8 Intermediate canopy (l p ¼ l f ¼ 0.16), Z s ¼ 0.5 H: concentration (g/m
3
) contours from the CFD model (left) and the fast model (right) at several horizontal planes
186
Urban Air Quality: Meteorological Processes
based on the parameterization of one-dimensional
wind and diffusivity profiles in terms of routinely
available meteorological parameters and morphological parameters such as l p and l f , which synthesize the main geometric characteristics of the
urban canopy.
Complex Urban Junction
The geometry of idealized building arrays is far
less complicated than the morphology of real
urban areas, where urban neighborhoods are
characterized by street intersections, asymmetric
street canyons, and staggered arrays of buildings
of irregular and/or highly variable shapes. These
local features significantly alter the flow and
dispersion patterns, as experimental and numerical
studies have concluded (see for example [32, 84,
85]). Reported here are some results of a modelling
study performed with a CFD code by employing
the RSM [86], and the advection-diffusion scheme
in a neighborhood in the city of Bari in southern
Italy. The real geometry comprises both step-up
and step-down street canyons and consists of two
asymmetric streets as shown in Fig. 9a. The
wider street canyon is characterized by an average aspect ratio W/H ~ 1.8 and it is perpendicular
to the wind direction. The other street canyon is
characterized by an average aspect ratio W/
H ~ 0.5 and is parallel to the wind direction.
The tallest building is ~ 46 m. The two canyons
intersect orthogonally forming four major blocks
of buildings and a junction. For the sake of computational convenience the real geometry was
slightly simplified, yet maintaining the main geometrical details of the street canyons. A fine
mesh close to the ground (up to a height of 4 m)
was used (Fig. 9b), with cell dimensions
δx min ¼ δy min ¼ 1 m, δz min ¼ 0.3 m. The number
of computational cells was approximately three
and a half million. Vectors of velocity magnitude
(m/s) and turbulent kinetic energy (m
2 /s
2 ) at
20
15
10
20
15
10
20
15
10
20
15
10
20
15
10
20
15
10
10
20
30
10
20
30
10
20
30
10
20
30
10
20
30
10
20
30
x/H
y/H
z=0.05H
z=H
z=2H
l
e
d
o
m
t
s
a
F
D
F
C
1.5
1
0.5
0.05
0.01
0.005
0
0.25
0.125
g/m3
Urban Air Quality: Meteorological Processes, Fig. 8 Intermediate canopy (l p ¼ l f ¼ 0.16), Z s ¼ 0.5 H: concentration (g/m
3
) contours from the CFD model (left) and the fast model (right) at several horizontal planes
186
Urban Air Quality: Meteorological Processes