

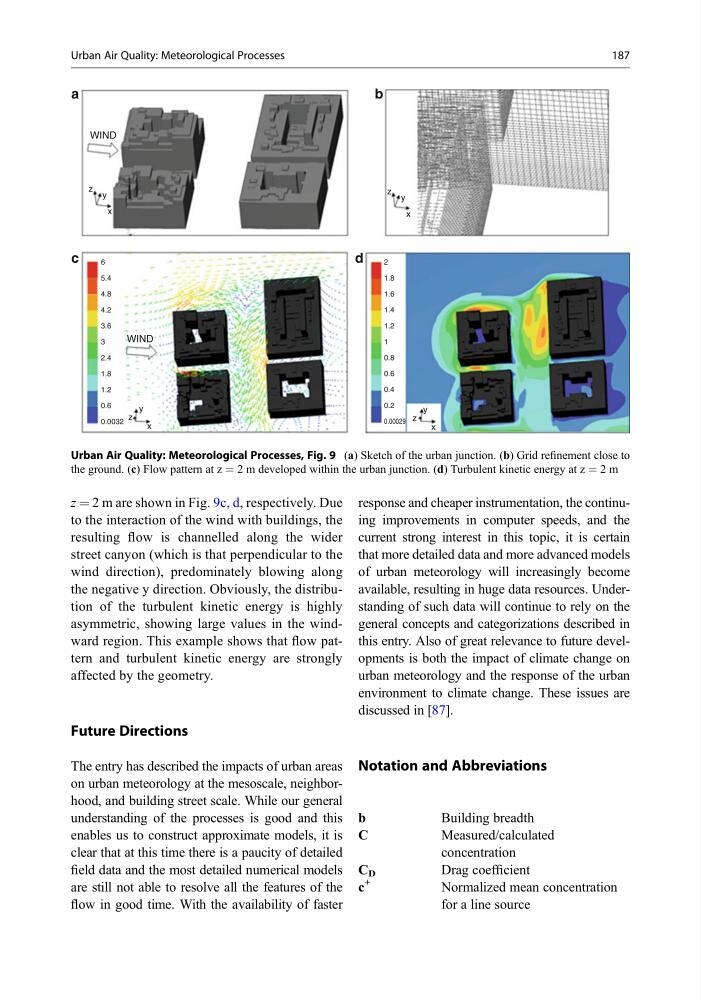
z ¼ 2 m are shown in Fig. 9c, d, respectively. Due
to the interaction of the wind with buildings, the
resulting flow is channelled along the wider
street canyon (which is that perpendicular to the
wind direction), predominately blowing along
the negative y direction. Obviously, the distribution of the turbulent kinetic energy is highly
asymmetric, showing large values in the windward region. This example shows that flow pattern and turbulent kinetic energy are strongly
affected by the geometry.
Future Directions
The entry has described the impacts of urban areas
on urban meteorology at the mesoscale, neighborhood, and building street scale. While our general
understanding of the processes is good and this
enables us to construct approximate models, it is
clear that at this time there is a paucity of detailed
field data and the most detailed numerical models
are still not able to resolve all the features of the
flow in good time. With the availability of faster
response and cheaper instrumentation, the continuing improvements in computer speeds, and the
current strong interest in this topic, it is certain
that more detailed data and more advanced models
of urban meteorology will increasingly become
available, resulting in huge data resources. Understanding of such data will continue to rely on the
general concepts and categorizations described in
this entry. Also of great relevance to future developments is both the impact of climate change on
urban meteorology and the response of the urban
environment to climate change. These issues are
discussed in [87].
Notation and Abbreviations
b
Building breadth
C
Measured/calculated
concentration
C D
Drag coefficient
c
+
Normalized mean concentration
for a line source
6
5.4
4.8
4.2
3.6
3
2.4
WIND
WIND
1.8
1.2
0.6
0.0032
2
1.8
1.6
1.4
1.2
1
0.8
0.6
0.4
0.2
0.00029
y
x
z
y
x
z
y
x
z
y
x
z
a
d
c
b
Urban Air Quality: Meteorological Processes, Fig. 9 (a) Sketch of the urban junction. (b) Grid refinement close to
the ground. (c) Flow pattern at z ¼ 2 m developed within the urban junction. (d) Turbulent kinetic energy at z ¼ 2 m
Urban Air Quality: Meteorological Processes
187
to the interaction of the wind with buildings, the
resulting flow is channelled along the wider
street canyon (which is that perpendicular to the
wind direction), predominately blowing along
the negative y direction. Obviously, the distribution of the turbulent kinetic energy is highly
asymmetric, showing large values in the windward region. This example shows that flow pattern and turbulent kinetic energy are strongly
affected by the geometry.
Future Directions
The entry has described the impacts of urban areas
on urban meteorology at the mesoscale, neighborhood, and building street scale. While our general
understanding of the processes is good and this
enables us to construct approximate models, it is
clear that at this time there is a paucity of detailed
field data and the most detailed numerical models
are still not able to resolve all the features of the
flow in good time. With the availability of faster
response and cheaper instrumentation, the continuing improvements in computer speeds, and the
current strong interest in this topic, it is certain
that more detailed data and more advanced models
of urban meteorology will increasingly become
available, resulting in huge data resources. Understanding of such data will continue to rely on the
general concepts and categorizations described in
this entry. Also of great relevance to future developments is both the impact of climate change on
urban meteorology and the response of the urban
environment to climate change. These issues are
discussed in [87].
Notation and Abbreviations
b
Building breadth
C
Measured/calculated
concentration
C D
Drag coefficient
c
+
Normalized mean concentration
for a line source
6
5.4
4.8
4.2
3.6
3
2.4
WIND
WIND
1.8
1.2
0.6
0.0032
2
1.8
1.6
1.4
1.2
1
0.8
0.6
0.4
0.2
0.00029
y
x
z
y
x
z
y
x
z
y
x
z
a
d
c
b
Urban Air Quality: Meteorological Processes, Fig. 9 (a) Sketch of the urban junction. (b) Grid refinement close to
the ground. (c) Flow pattern at z ¼ 2 m developed within the urban junction. (d) Turbulent kinetic energy at z ¼ 2 m
Urban Air Quality: Meteorological Processes
187