

buoyancy and inertial forces are essentially indicated by the value of the Froude number, defined
as the ratio of the geostrophic wind U G to the
average velocity U B produced by the buoyancy
forces acting over the urban area, i.e., F ¼ U G /U B .
U B is driven by the horizontal temperature and
hence density changes A6, which may be natural
or caused by the urban heat island, and is defined by
U B ¼
ffiffiffiffiffiffiffiffiffiffiffiffiffiffiffiffiffiffiffiffiffiffiffiffi
gl 0 j Dy j =y
p
, where l 0 is the internal layer
thickness or the height of the nearby mountains if
these dominate the flow and g is gravitational acceleration. Note that Δθ/θ depends on a number of
features of the urban area, the most important
being the increased heat storage due to urban buildings, which increases temperature (urban heat
island) and the impact of vegetation inside and
outside the urban area, which may reduce temperature. Typically the heat island causes increases in
temperature of a few degrees in a small town [4, 5]
so that |Δθ|/θ ~ 0.01 and U B ~ 3 m/s. Larger urban
areas show a much higher urban heat island effect
(up to 12 C for cities in arid or semiarid environments, [6]) leading to larger values of U B . Coriolis
effects are significant if L o is comparable or greater
than the mesoscale length scales.
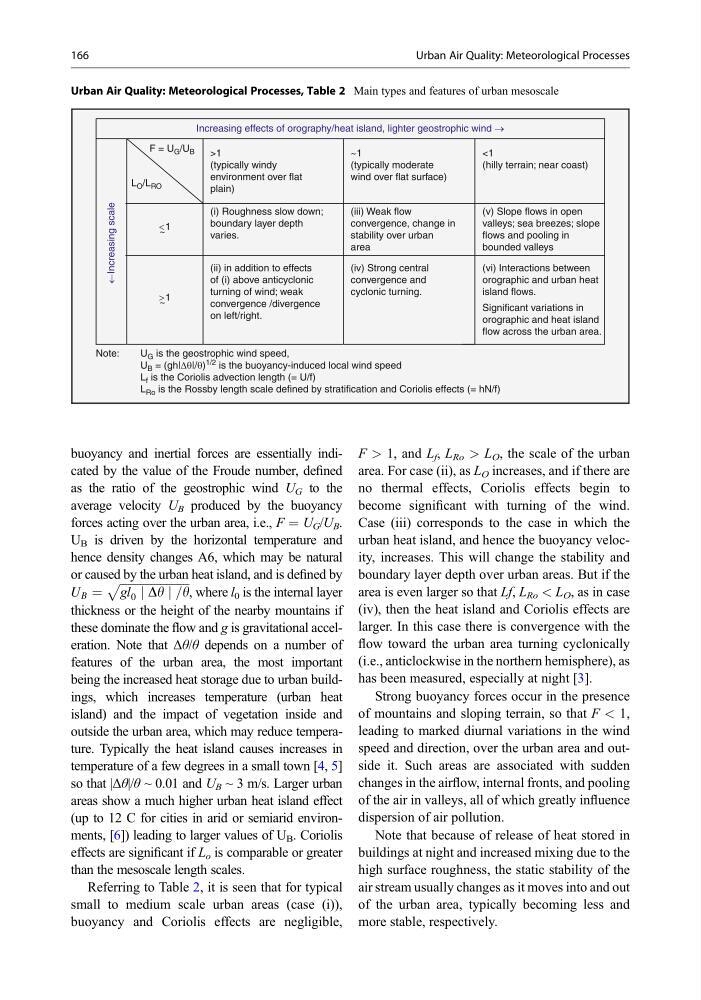
Referring to Table 2, it is seen that for typical
small to medium scale urban areas (case (i)),
buoyancy and Coriolis effects are negligible,
F > 1, and L f , L Ro > L O , the scale of the urban
area. For case (ii), as L O increases, and if there are
no thermal effects, Coriolis effects begin to
become significant with turning of the wind.
Case (iii) corresponds to the case in which the
urban heat island, and hence the buoyancy velocity, increases. This will change the stability and
boundary layer depth over urban areas. But if the
area is even larger so that Lf, L Ro < L O , as in case
(iv), then the heat island and Coriolis effects are
larger. In this case there is convergence with the
flow toward the urban area turning cyclonically
(i.e., anticlockwise in the northern hemisphere), as
has been measured, especially at night [3].
Strong buoyancy forces occur in the presence
of mountains and sloping terrain, so that F < 1,
leading to marked diurnal variations in the wind
speed and direction, over the urban area and outside it. Such areas are associated with sudden
changes in the airflow, internal fronts, and pooling
of the air in valleys, all of which greatly influence
dispersion of air pollution.
Note that because of release of heat stored in
buildings at night and increased mixing due to the
high surface roughness, the static stability of the
air stream usually changes as it moves into and out
of the urban area, typically becoming less and
more stable, respectively.
Urban Air Quality: Meteorological Processes, Table 2 Main types and features of urban mesoscale
F = U G /U B
Increasing effects of orography/heat island, lighter geostrophic wind →
←Increasing scale
L O /L RO
>1
(typically windy
environment over flat
plain)
~1
(typically moderate
wind over flat surface)
<1
(hilly terrain; near coast)
<
~
1
>
~
1
(i) Roughness slow down;
boundary layer depth
varies.
(iii) Weak flow
convergence, change in
stability over urban
area
(v) Slope flows in open
valleys; sea breezes; slope
flows and pooling in
bounded valleys
(ii) in addition to effects
of (i) above anticyclonic
turning of wind; weak
convergence /divergence
on left/right.
(iv) Strong central
convergence and
cyclonic turning.
(vi) Interactions between
orographic and urban heat
island flows.
Significant variations in
orographic and heat island
flow across the urban area.
Note:
U G is the geostrophic wind speed,
U B = (gh|Δθ|/θ)
1/2 is the buoyancy-induced local wind speed
L f is the Coriolis advection length (= U/f)
L Ro is the Rossby length scale defined by stratification and Coriolis effects (= hN/f)
166
Urban Air Quality: Meteorological Processes
as the ratio of the geostrophic wind U G to the
average velocity U B produced by the buoyancy
forces acting over the urban area, i.e., F ¼ U G /U B .
U B is driven by the horizontal temperature and
hence density changes A6, which may be natural
or caused by the urban heat island, and is defined by
U B ¼
ffiffiffiffiffiffiffiffiffiffiffiffiffiffiffiffiffiffiffiffiffiffiffiffi
gl 0 j Dy j =y
p
, where l 0 is the internal layer
thickness or the height of the nearby mountains if
these dominate the flow and g is gravitational acceleration. Note that Δθ/θ depends on a number of
features of the urban area, the most important
being the increased heat storage due to urban buildings, which increases temperature (urban heat
island) and the impact of vegetation inside and
outside the urban area, which may reduce temperature. Typically the heat island causes increases in
temperature of a few degrees in a small town [4, 5]
so that |Δθ|/θ ~ 0.01 and U B ~ 3 m/s. Larger urban
areas show a much higher urban heat island effect
(up to 12 C for cities in arid or semiarid environments, [6]) leading to larger values of U B . Coriolis
effects are significant if L o is comparable or greater
than the mesoscale length scales.
Referring to Table 2, it is seen that for typical
small to medium scale urban areas (case (i)),
buoyancy and Coriolis effects are negligible,
F > 1, and L f , L Ro > L O , the scale of the urban
area. For case (ii), as L O increases, and if there are
no thermal effects, Coriolis effects begin to
become significant with turning of the wind.
Case (iii) corresponds to the case in which the
urban heat island, and hence the buoyancy velocity, increases. This will change the stability and
boundary layer depth over urban areas. But if the
area is even larger so that Lf, L Ro < L O , as in case
(iv), then the heat island and Coriolis effects are
larger. In this case there is convergence with the
flow toward the urban area turning cyclonically
(i.e., anticlockwise in the northern hemisphere), as
has been measured, especially at night [3].
Strong buoyancy forces occur in the presence
of mountains and sloping terrain, so that F < 1,
leading to marked diurnal variations in the wind
speed and direction, over the urban area and outside it. Such areas are associated with sudden
changes in the airflow, internal fronts, and pooling
of the air in valleys, all of which greatly influence
dispersion of air pollution.
Note that because of release of heat stored in
buildings at night and increased mixing due to the
high surface roughness, the static stability of the
air stream usually changes as it moves into and out
of the urban area, typically becoming less and
more stable, respectively.
Urban Air Quality: Meteorological Processes, Table 2 Main types and features of urban mesoscale
F = U G /U B
Increasing effects of orography/heat island, lighter geostrophic wind →
←Increasing scale
L O /L RO
>1
(typically windy
environment over flat
plain)
~1
(typically moderate
wind over flat surface)
<1
(hilly terrain; near coast)
<
~
1
>
~
1
(i) Roughness slow down;
boundary layer depth
varies.
(iii) Weak flow
convergence, change in
stability over urban
area
(v) Slope flows in open
valleys; sea breezes; slope
flows and pooling in
bounded valleys
(ii) in addition to effects
of (i) above anticyclonic
turning of wind; weak
convergence /divergence
on left/right.
(iv) Strong central
convergence and
cyclonic turning.
(vi) Interactions between
orographic and urban heat
island flows.
Significant variations in
orographic and heat island
flow across the urban area.
Note:
U G is the geostrophic wind speed,
U B = (gh|Δθ|/θ)
1/2 is the buoyancy-induced local wind speed
L f is the Coriolis advection length (= U/f)
L Ro is the Rossby length scale defined by stratification and Coriolis effects (= hN/f)
166
Urban Air Quality: Meteorological Processes