

remain. Both the high noise level and high energy
consumption inhibit use in many cases.
Another system to enhance the agglomeration
of nanoparticles was recently introduced by Zhao
et al. [91]. They developed an effective pretreatment agglomeration system to reduce downstream problems related to UFPs. As shown in
Fig. 21a, b, Zhao et al. used a simple method to
modify the flow in ducts in which two dampers
(a batch flow duct to simulate indoor stagnant air)
or one damper (a continuous flow duct to simulate
a continuous airflow being treated in a downstream cleaner device) was installed. The particle
number in the batch chamber was decreased by
73% over 30 min. It was found that the damper
movement facilitated particle collision and
agglomeration by increasing the flow oscillations,
in essence, by increasing turbulence. By fitting a
damper with a cycle time of 1 s, the particle
capture efficiency of the downstream filters
increased from 36% to 48%. The particle size
distribution was found to be larger after the
damper demonstrating the agglomeration of the
particles during the process (Fig. 21c).
Nanoparticle Detection
Experimental aerosol research dates back more
than 100 years ago when John Aitken built a
device to count dust particles in air [5]. Today
there are many techniques for detecting and characterizing particles that use properties such as
mass, optical absorption and scattering, impaction, and electrostatic and diffusional behavior to
yield information on the mass and number concentration, and size distribution, of aerosol samples. In some cases the methods are used in
combination. In an urban area, as shown in
Fig. 22, a majority of particles by number concentration are typically found in the nucleation and
Aitken modes. The picture changes, however, if
volume or surface distributions are considered.
Stanier et al. [98] and Woo et al. [99] reported
that nearly 25%, 75%, and 90% of total urban
particle number are smaller than 10, 50, and
100 nm, respectively. Similarly, in another study
of particle distributions in five European cities, it
was found that more than 80% of particles were
under the nucleation and Aitken mode ranges
[100]. Table 8 presents a summary of the instruments used to measure nanoparticles.
Aerosol Particle Mass Analyzer (APM)
An aerosol particle mass analyzer (APM) was
developed by Ehara et al.; an APM instrument is
now commercially available from Kanomax
(Model 3602). After charging particles in a bipolar charger, the aerosol passes between two rotating coaxial cylindrical electrodes, which rotate at
the same angular velocity. Two forces, the centrifugal force and the electrostatic force, affect the
particles passing between the electrodes. Only
those particles for which the forces balance
move the length of the sizer and exit through an
annular gap. For a given radius of cylinders (r 1 ,
r 2 ), angular velocity (w), particle charge (q), and
the voltage between cylinders (V), the mass to
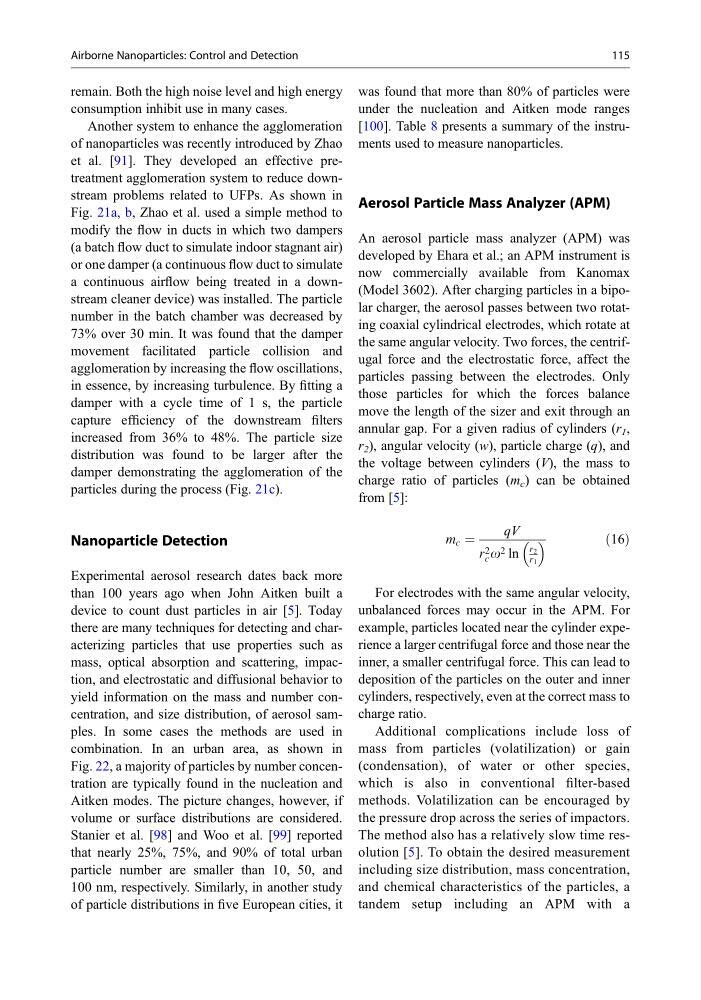
charge ratio of particles (m c ) can be obtained
from [5]:
m c ¼
qV
r 2
c o 2 ln
r 2
r 1
ð16Þ
For electrodes with the same angular velocity,
unbalanced forces may occur in the APM. For
example, particles located near the cylinder experience a larger centrifugal force and those near the
inner, a smaller centrifugal force. This can lead to
deposition of the particles on the outer and inner
cylinders, respectively, even at the correct mass to
charge ratio.
Additional complications include loss of
mass from particles (volatilization) or gain
(condensation), of water or other species,
which is also in conventional filter-based
methods. Volatilization can be encouraged by
the pressure drop across the series of impactors.
The method also has a relatively slow time resolution [5]. To obtain the desired measurement
including size distribution, mass concentration,
and chemical characteristics of the particles, a
tandem setup including an APM with a
Airborne Nanoparticles: Control and Detection
115
consumption inhibit use in many cases.
Another system to enhance the agglomeration
of nanoparticles was recently introduced by Zhao
et al. [91]. They developed an effective pretreatment agglomeration system to reduce downstream problems related to UFPs. As shown in
Fig. 21a, b, Zhao et al. used a simple method to
modify the flow in ducts in which two dampers
(a batch flow duct to simulate indoor stagnant air)
or one damper (a continuous flow duct to simulate
a continuous airflow being treated in a downstream cleaner device) was installed. The particle
number in the batch chamber was decreased by
73% over 30 min. It was found that the damper
movement facilitated particle collision and
agglomeration by increasing the flow oscillations,
in essence, by increasing turbulence. By fitting a
damper with a cycle time of 1 s, the particle
capture efficiency of the downstream filters
increased from 36% to 48%. The particle size
distribution was found to be larger after the
damper demonstrating the agglomeration of the
particles during the process (Fig. 21c).
Nanoparticle Detection
Experimental aerosol research dates back more
than 100 years ago when John Aitken built a
device to count dust particles in air [5]. Today
there are many techniques for detecting and characterizing particles that use properties such as
mass, optical absorption and scattering, impaction, and electrostatic and diffusional behavior to
yield information on the mass and number concentration, and size distribution, of aerosol samples. In some cases the methods are used in
combination. In an urban area, as shown in
Fig. 22, a majority of particles by number concentration are typically found in the nucleation and
Aitken modes. The picture changes, however, if
volume or surface distributions are considered.
Stanier et al. [98] and Woo et al. [99] reported
that nearly 25%, 75%, and 90% of total urban
particle number are smaller than 10, 50, and
100 nm, respectively. Similarly, in another study
of particle distributions in five European cities, it
was found that more than 80% of particles were
under the nucleation and Aitken mode ranges
[100]. Table 8 presents a summary of the instruments used to measure nanoparticles.
Aerosol Particle Mass Analyzer (APM)
An aerosol particle mass analyzer (APM) was
developed by Ehara et al.; an APM instrument is
now commercially available from Kanomax
(Model 3602). After charging particles in a bipolar charger, the aerosol passes between two rotating coaxial cylindrical electrodes, which rotate at
the same angular velocity. Two forces, the centrifugal force and the electrostatic force, affect the
particles passing between the electrodes. Only
those particles for which the forces balance
move the length of the sizer and exit through an
annular gap. For a given radius of cylinders (r 1 ,
r 2 ), angular velocity (w), particle charge (q), and
the voltage between cylinders (V), the mass to
charge ratio of particles (m c ) can be obtained
from [5]:
m c ¼
qV
r 2
c o 2 ln
r 2
r 1
ð16Þ
For electrodes with the same angular velocity,
unbalanced forces may occur in the APM. For
example, particles located near the cylinder experience a larger centrifugal force and those near the
inner, a smaller centrifugal force. This can lead to
deposition of the particles on the outer and inner
cylinders, respectively, even at the correct mass to
charge ratio.
Additional complications include loss of
mass from particles (volatilization) or gain
(condensation), of water or other species,
which is also in conventional filter-based
methods. Volatilization can be encouraged by
the pressure drop across the series of impactors.
The method also has a relatively slow time resolution [5]. To obtain the desired measurement
including size distribution, mass concentration,
and chemical characteristics of the particles, a
tandem setup including an APM with a
Airborne Nanoparticles: Control and Detection
115