

advanced beam manipulation, cooling, damping and stability 221
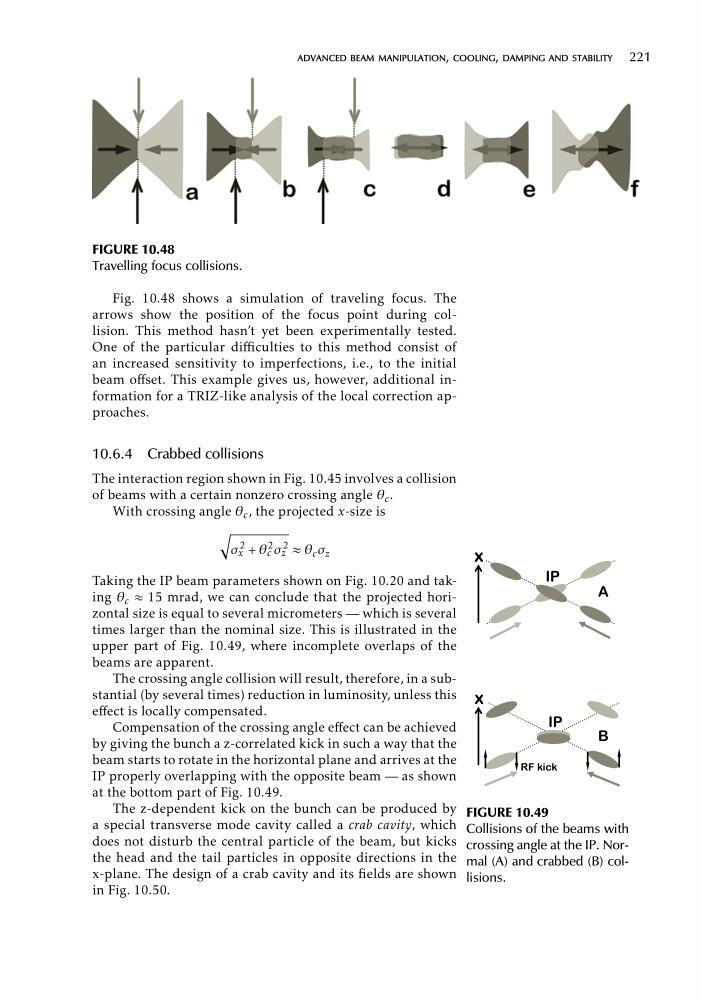
FIGURE 10.48
Travelling focus collisions.
Fig. 10.48 shows a simulation of traveling focus. The
arrows show the position of the focus point during collision. This method hasn’t yet been experimentally tested.
One of the particular difficulties to this method consist of
an increased sensitivity to imperfections, i.e., to the initial
beam offset. This example gives us, however, additional information for a TRIZ-like analysis of the local correction approaches.
10.6.4 Crabbed collisions
The interaction region shown in Fig. 10.45 involves a collision
of beams with a certain nonzero crossing angle θ c .
With crossing angle θ c , the projected x-size is
)
σ
2 + θ
2 σ
2
x
c z ≈ θ c σ z
Taking the IP beam parameters shown on Fig. 10.20 and taking θ c ≈ 15 mrad, we can conclude that the projected horizontal size is equal to several micrometers — which is several
times larger than the nominal size. This is illustrated in the
upper part of Fig. 10.49, where incomplete overlaps of the
beams are apparent.
The crossing angle collision will result, therefore, in a substantial (by several times) reduction in luminosity, unless this
effect is locally compensated.
Compensation of the crossing angle effect can be achieved
by giving the bunch a z-correlated kick in such a way that the
beam starts to rotate in the horizontal plane and arrives at the
IP properly overlapping with the opposite beam — as shown
at the bottom part of Fig. 10.49.
The z-dependent kick on the bunch can be produced by
a special transverse mode cavity called a crab cavity, which
does not disturb the central particle of the beam, but kicks
the head and the tail particles in opposite directions in the
x-plane. The design of a crab cavity and its fields are shown
in Fig. 10.50.
[
,3
$
[
,3
%
5)NLFN
FIGURE 10.49
Collisions of the beams with
crossing angle at the IP. Normal (A) and crabbed (B) collisions.
FIGURE 10.48
Travelling focus collisions.
Fig. 10.48 shows a simulation of traveling focus. The
arrows show the position of the focus point during collision. This method hasn’t yet been experimentally tested.
One of the particular difficulties to this method consist of
an increased sensitivity to imperfections, i.e., to the initial
beam offset. This example gives us, however, additional information for a TRIZ-like analysis of the local correction approaches.
10.6.4 Crabbed collisions
The interaction region shown in Fig. 10.45 involves a collision
of beams with a certain nonzero crossing angle θ c .
With crossing angle θ c , the projected x-size is
)
σ
2 + θ
2 σ
2
x
c z ≈ θ c σ z
Taking the IP beam parameters shown on Fig. 10.20 and taking θ c ≈ 15 mrad, we can conclude that the projected horizontal size is equal to several micrometers — which is several
times larger than the nominal size. This is illustrated in the
upper part of Fig. 10.49, where incomplete overlaps of the
beams are apparent.
The crossing angle collision will result, therefore, in a substantial (by several times) reduction in luminosity, unless this
effect is locally compensated.
Compensation of the crossing angle effect can be achieved
by giving the bunch a z-correlated kick in such a way that the
beam starts to rotate in the horizontal plane and arrives at the
IP properly overlapping with the opposite beam — as shown
at the bottom part of Fig. 10.49.
The z-dependent kick on the bunch can be produced by
a special transverse mode cavity called a crab cavity, which
does not disturb the central particle of the beam, but kicks
the head and the tail particles in opposite directions in the
x-plane. The design of a crab cavity and its fields are shown
in Fig. 10.50.
[
,3
$
[
,3
%
5)NLFN
FIGURE 10.49
Collisions of the beams with
crossing angle at the IP. Normal (A) and crabbed (B) collisions.