

plasma acceleration 109
The corresponding atomic intensity is thus equal to
ε cE 2
0 a
W
I a =
� 3.51 × 10
16
(6.12)
2
cm 2
A laser with intensity higher than the above will ionize gas
immediately. However, as we will show in the next sections,
ionization can occur well below this threshold due to multiphoton effects or tunneling ionization.
6.3.3 Progress in laser peak intensity
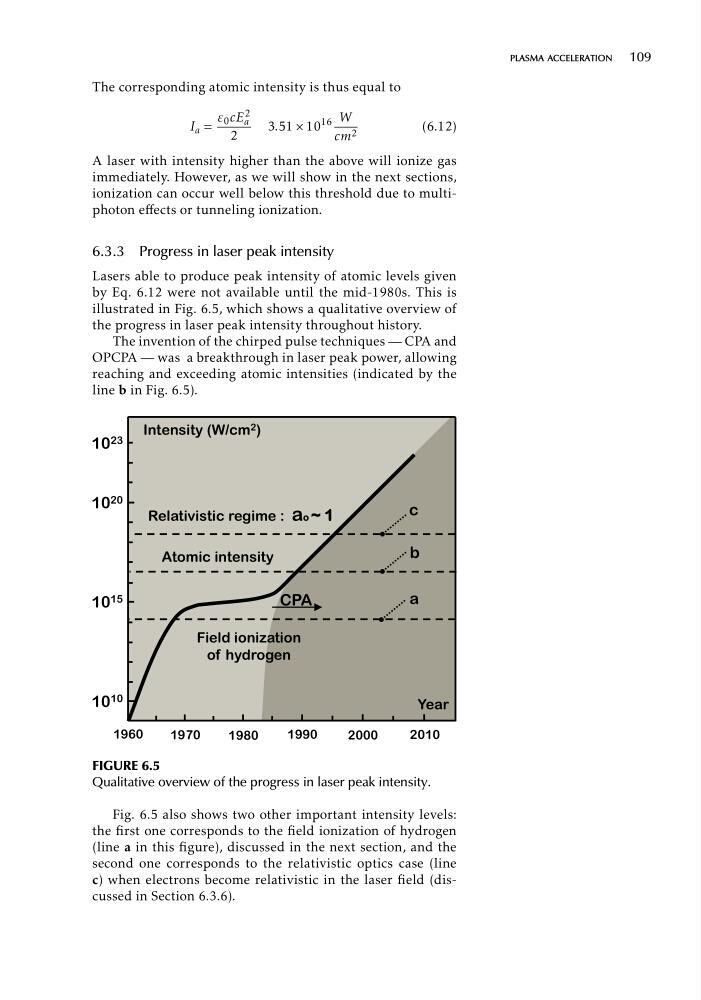
Lasers able to produce peak intensity of atomic levels given
by Eq. 6.12 were not available until the mid-1980s. This is
illustrated in Fig. 6.5, which shows a qualitative overview of
the progress in laser peak intensity throughout history.
The invention of the chirped pulse techniques — CPA and
OPCPA — was a breakthrough in laser peak power, allowing
reaching and exceeding atomic intensities (indicated by the
line b in Fig. 6.5).
,QWHQVLW\:FP
$WRPLFLQWHQVLW\
5HODWLYLVWLFUHJLPHD
)LHOGLRQL]DWLRQ
RI K\GURJHQ
&3$
E
D
FIGURE 6.5
Qualitative overview of the progress in laser peak intensity.
Fig. 6.5 also shows two other important intensity levels:
the first one corresponds to the field ionization of hydrogen
(line a in this figure), discussed in the next section, and the
second one corresponds to the relativistic optics case (line
c) when electrons become relativistic in the laser field (discussed in Section 6.3.6).
The corresponding atomic intensity is thus equal to
ε cE 2
0 a
W
I a =
� 3.51 × 10
16
(6.12)
2
cm 2
A laser with intensity higher than the above will ionize gas
immediately. However, as we will show in the next sections,
ionization can occur well below this threshold due to multiphoton effects or tunneling ionization.
6.3.3 Progress in laser peak intensity
Lasers able to produce peak intensity of atomic levels given
by Eq. 6.12 were not available until the mid-1980s. This is
illustrated in Fig. 6.5, which shows a qualitative overview of
the progress in laser peak intensity throughout history.
The invention of the chirped pulse techniques — CPA and
OPCPA — was a breakthrough in laser peak power, allowing
reaching and exceeding atomic intensities (indicated by the
line b in Fig. 6.5).
,QWHQVLW\:FP
$WRPLFLQWHQVLW\
5HODWLYLVWLFUHJLPHD
)LHOGLRQL]DWLRQ
RI K\GURJHQ
&3$
E
D
FIGURE 6.5
Qualitative overview of the progress in laser peak intensity.
Fig. 6.5 also shows two other important intensity levels:
the first one corresponds to the field ionization of hydrogen
(line a in this figure), discussed in the next section, and the
second one corresponds to the relativistic optics case (line
c) when electrons become relativistic in the laser field (discussed in Section 6.3.6).