

Lattice Modules
209
0
1
1
d
2f 1
d
2f 2
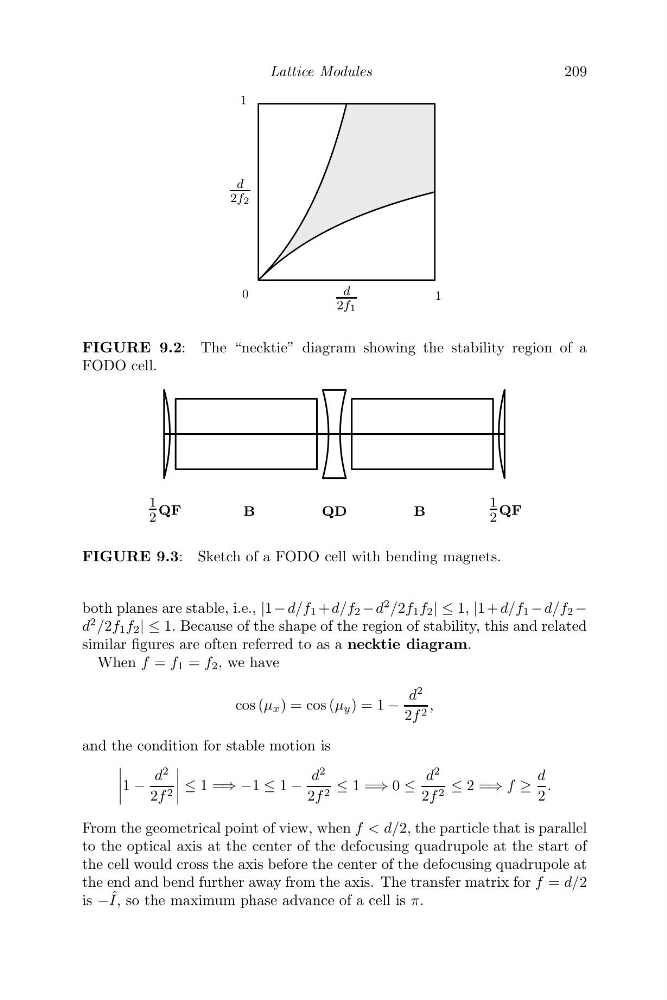
FIGURE 9.2: The “necktie” diagram showing the stability region of a
FODO cell.
1
2
QF
B
Q D
B
1
2
QF
FIGURE 9.3: Sketch of a FODO cell with bending magnets.
both planes are stable, i.e., |1 − d/f 1 + d/f 2 − d
2 /2f 1 f 2 | ≤ 1, |1 + d/f 1 − d/f 2 −
d
2 /2f 1 f 2 | ≤ 1. Because of the shape of the region of stability, this and related
similar figures are often referred to as a necktie diagram.
When f = f 1 = f 2 , we have
cos (μ x ) = cos (μ y ) = 1 −
d
2
2f 2 ,
and the condition for stable motion is
1 −
d
2
2f 2
≤ 1 =⇒ −1 ≤ 1 −
d
2
2f 2 ≤ 1 =⇒ 0 ≤
d
2
2f 2 ≤ 2 =⇒ f ≥
d
2
.
From the geometrical point of view, when f < d/2, the particle that is parallel
to the optical axis at the center of the defocusing quadrupole at the start of
the cell would cross the axis before the center of the defocusing quadrupole at
the end and bend further away from the axis. The transfer matrix for f = d/2
is − ˆ
I, so the maximum phase advance of a cell is π.
209
0
1
1
d
2f 1
d
2f 2
FIGURE 9.2: The “necktie” diagram showing the stability region of a
FODO cell.
1
2
QF
B
Q D
B
1
2
QF
FIGURE 9.3: Sketch of a FODO cell with bending magnets.
both planes are stable, i.e., |1 − d/f 1 + d/f 2 − d
2 /2f 1 f 2 | ≤ 1, |1 + d/f 1 − d/f 2 −
d
2 /2f 1 f 2 | ≤ 1. Because of the shape of the region of stability, this and related
similar figures are often referred to as a necktie diagram.
When f = f 1 = f 2 , we have
cos (μ x ) = cos (μ y ) = 1 −
d
2
2f 2 ,
and the condition for stable motion is
1 −
d
2
2f 2
≤ 1 =⇒ −1 ≤ 1 −
d
2
2f 2 ≤ 1 =⇒ 0 ≤
d
2
2f 2 ≤ 2 =⇒ f ≥
d
2
.
From the geometrical point of view, when f < d/2, the particle that is parallel
to the optical axis at the center of the defocusing quadrupole at the start of
the cell would cross the axis before the center of the defocusing quadrupole at
the end and bend further away from the axis. The transfer matrix for f = d/2
is − ˆ
I, so the maximum phase advance of a cell is π.