

168
An Introduction to Beam Physics
',
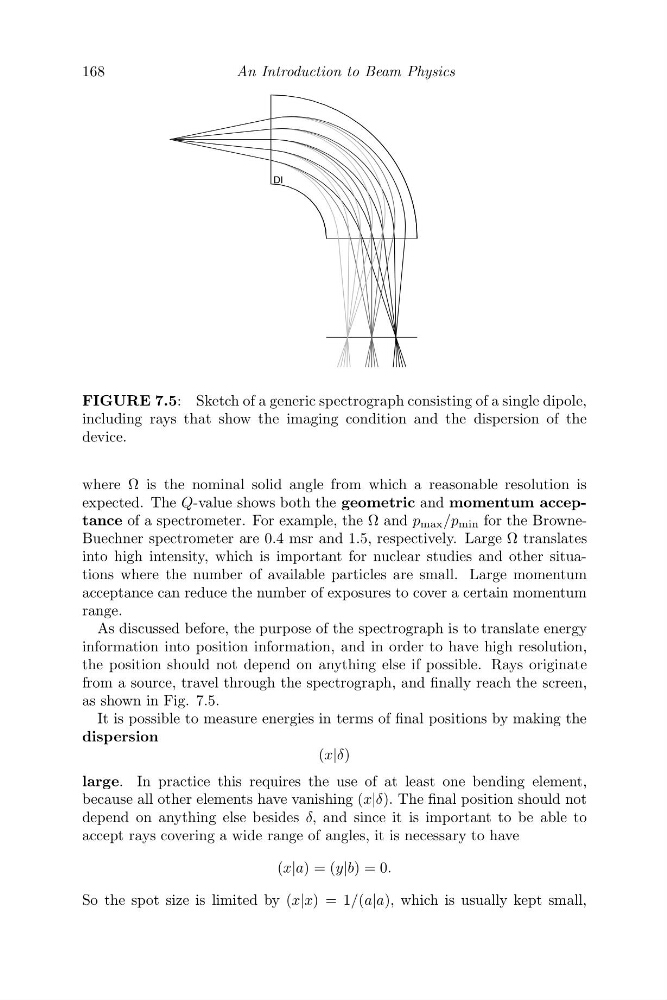
FIGURE 7.5: Sketch of a generic spectrograph consisting of a single dipole,
including rays that show the imaging condition and the dispersion of the
device.
where Ω is the nominal solid angle from which a reasonable resolution is
expected. The Q-value shows both the geometric and momentum acceptance of a spectrometer. For example, the Ω and p max /p min for the BrowneBuechner spectrometer are 0.4 msr and 1.5, respectively. Large Ω translates
into high intensity, which is important for nuclear studies and other situations where the number of available particles are small. Large momentum
acceptance can reduce the number of exposures to cover a certain momentum
range.
As discussed before, the purpose of the spectrograph is to translate energy
information into position information, and in order to have high resolution,
the position should not depend on anything else if possible. Rays originate
from a source, travel through the spectrograph, and finally reach the screen,
as shown in Fig. 7.5.
It is possible to measure energies in terms of final positions by making the
dispersion
(x|δ)
large. In practice this requires the use of at least one bending element,
because all other elements have vanishing (x|δ). The final position should not
depend on anything else besides δ, and since it is important to be able to
accept rays covering a wide range of angles, it is necessary to have
(x|a) = (y|b) = 0.
So the spot size is limited by (x|x) = 1/(a|a), which is usually kept small,
An Introduction to Beam Physics
',
FIGURE 7.5: Sketch of a generic spectrograph consisting of a single dipole,
including rays that show the imaging condition and the dispersion of the
device.
where Ω is the nominal solid angle from which a reasonable resolution is
expected. The Q-value shows both the geometric and momentum acceptance of a spectrometer. For example, the Ω and p max /p min for the BrowneBuechner spectrometer are 0.4 msr and 1.5, respectively. Large Ω translates
into high intensity, which is important for nuclear studies and other situations where the number of available particles are small. Large momentum
acceptance can reduce the number of exposures to cover a certain momentum
range.
As discussed before, the purpose of the spectrograph is to translate energy
information into position information, and in order to have high resolution,
the position should not depend on anything else if possible. Rays originate
from a source, travel through the spectrograph, and finally reach the screen,
as shown in Fig. 7.5.
It is possible to measure energies in terms of final positions by making the
dispersion
(x|δ)
large. In practice this requires the use of at least one bending element,
because all other elements have vanishing (x|δ). The final position should not
depend on anything else besides δ, and since it is important to be able to
accept rays covering a wide range of angles, it is necessary to have
(x|a) = (y|b) = 0.
So the spot size is limited by (x|x) = 1/(a|a), which is usually kept small,