

172 Damage to concrete structures
Portland hydration will be consumed by the reaction of the slag. This
leads to a reduced Ca(OH) 2 content, and thus less carbonatable material.
On the other hand, a more dense pore system can be obtained, although
the reactions proceed more slowly. Nevertheless, the final pore structure
depends heavily on the curing conditions. Insufficient curing will lead to
more open pore structures in the case of binders containing blast furnace
slag. The precise effect on the carbonation process is difficult to predict,
and literature shows a large variation in results. In this context, it should be
mentioned that curing conditions in laboratory research are typically much
better than in real conditions. In general, it can be expected that in real
concrete structures containing blast furnace slag, carbonation proceeds significantly more rapidly than in the case of pure Portland-based concrete.
In the case of cement replacement by fly ash or other puzzolanic materials,
similar phenomena can be found as for blast furnace slag, typically leading to increased carbonation rates and depths. However, in the case of the
additional application of fly ash without cement reduction, a more dense
structure can be obtained which results in a reduced carbonation rate.
Carbonation of concrete itself does not cause any real damage to the
concrete structure. It only provides the conditions required for reinforcement corrosion to occur. As soon as the steel reinforcement is depassivated,
corrosion can propagate. The corrosion rate depends on the availability of
water and oxygen. The highest corrosion rates are obtained in the case of
cyclic wetting and drying, e.g. due to tidal effect or rain. Permanently wet
concrete, e.g. concrete under water, will not corrode because the diffusion
of oxygen is extremely slow.
In the case of a constant relative humidity in the environment, the highest corrosion rates will be found for a relative humidity around 95% with
decreasing corrosion rates for decreasing relative humidity, as illustrated in
√Time
Carbonation Depth
√ T i m
e r e l a t i o n
Ultimate value
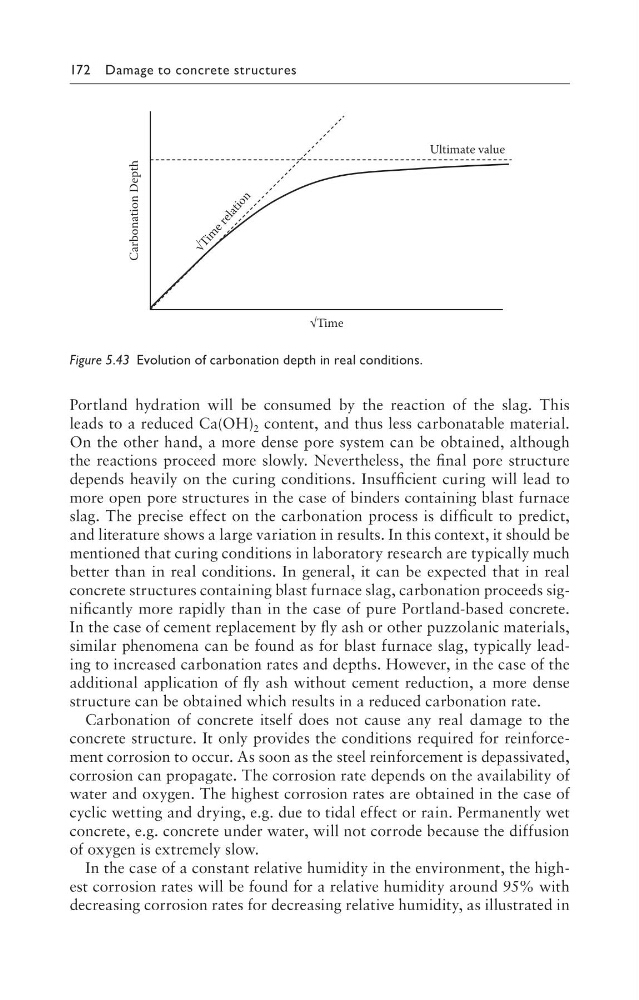
Figure 5.43 Evolution of carbonation depth in real conditions.
Portland hydration will be consumed by the reaction of the slag. This
leads to a reduced Ca(OH) 2 content, and thus less carbonatable material.
On the other hand, a more dense pore system can be obtained, although
the reactions proceed more slowly. Nevertheless, the final pore structure
depends heavily on the curing conditions. Insufficient curing will lead to
more open pore structures in the case of binders containing blast furnace
slag. The precise effect on the carbonation process is difficult to predict,
and literature shows a large variation in results. In this context, it should be
mentioned that curing conditions in laboratory research are typically much
better than in real conditions. In general, it can be expected that in real
concrete structures containing blast furnace slag, carbonation proceeds significantly more rapidly than in the case of pure Portland-based concrete.
In the case of cement replacement by fly ash or other puzzolanic materials,
similar phenomena can be found as for blast furnace slag, typically leading to increased carbonation rates and depths. However, in the case of the
additional application of fly ash without cement reduction, a more dense
structure can be obtained which results in a reduced carbonation rate.
Carbonation of concrete itself does not cause any real damage to the
concrete structure. It only provides the conditions required for reinforcement corrosion to occur. As soon as the steel reinforcement is depassivated,
corrosion can propagate. The corrosion rate depends on the availability of
water and oxygen. The highest corrosion rates are obtained in the case of
cyclic wetting and drying, e.g. due to tidal effect or rain. Permanently wet
concrete, e.g. concrete under water, will not corrode because the diffusion
of oxygen is extremely slow.
In the case of a constant relative humidity in the environment, the highest corrosion rates will be found for a relative humidity around 95% with
decreasing corrosion rates for decreasing relative humidity, as illustrated in
√Time
Carbonation Depth
√ T i m
e r e l a t i o n
Ultimate value
Figure 5.43 Evolution of carbonation depth in real conditions.