

634
C. B. Chrusciak et al.
Table 1 Cronbach’s Alpha.
Source Authors, 2020
Construct
Cronbach’s Alpha
General
0,955,399,954
Environment
0,818,716,897
Biomechanics
0,875,334,319
Work content
0,608,543,986
Work organization
0,890,322,714
Risk
0,633,263,394
Enterprise
0,877,536,043
through the questionnaires. The formula used to obtain this priority indicator is indicated in (1). The formula considers the divergence between the results of satisfaction
and the importance of the factors evaluated by the respondents, so, the greater the
divergence, the greater the priority.
Priorit y =
((15 − satis f action) ∗ importance)
15
(1)
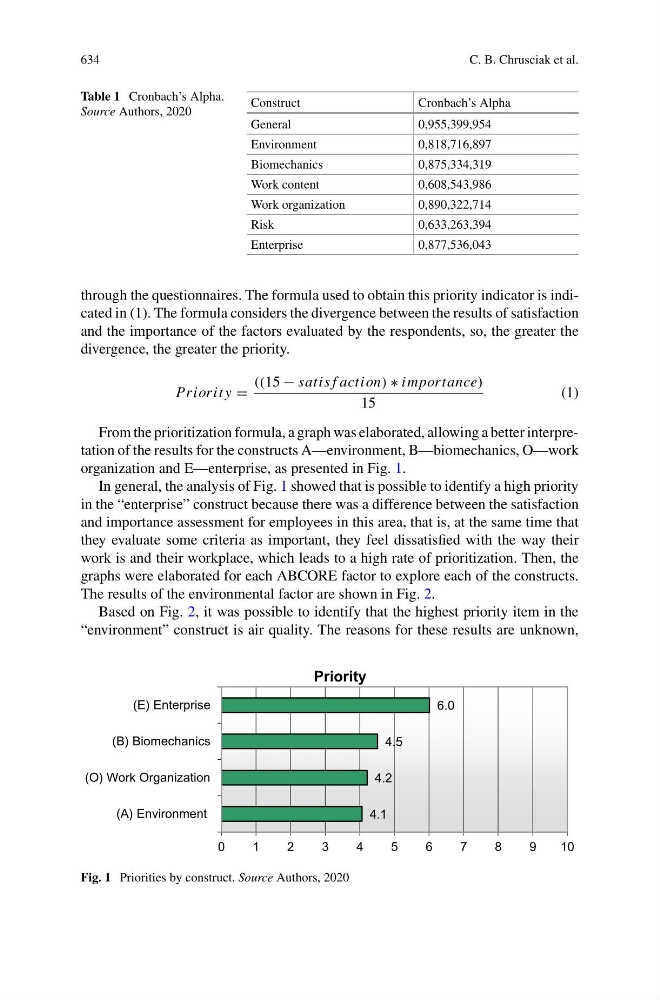
From the prioritization formula, a graph was elaborated, allowing a better interpretation of the results for the constructs A—environment, B—biomechanics, O—work
organization and E—enterprise, as presented in Fig. 1.
In general, the analysis of Fig. 1 showed that is possible to identify a high priority
in the “enterprise” construct because there was a difference between the satisfaction
and importance assessment for employees in this area, that is, at the same time that
they evaluate some criteria as important, they feel dissatisfied with the way their
work is and their workplace, which leads to a high rate of prioritization. Then, the
graphs were elaborated for each ABCORE factor to explore each of the constructs.
The results of the environmental factor are shown in Fig. 2.
Based on Fig. 2, it was possible to identify that the highest priority item in the
“environment” construct is air quality. The reasons for these results are unknown,
4.1
4.2
4.5
6.0
0
1
2
3
4
5
6
7
8
9
10
(A) Environment
(O) Work Organization
(B) Biomechanics
(E) Enterprise
Priority
Fig. 1 Priorities by construct. Source Authors, 2020