

The Social License to Operate as a Tool to Promote Sustainability …
419
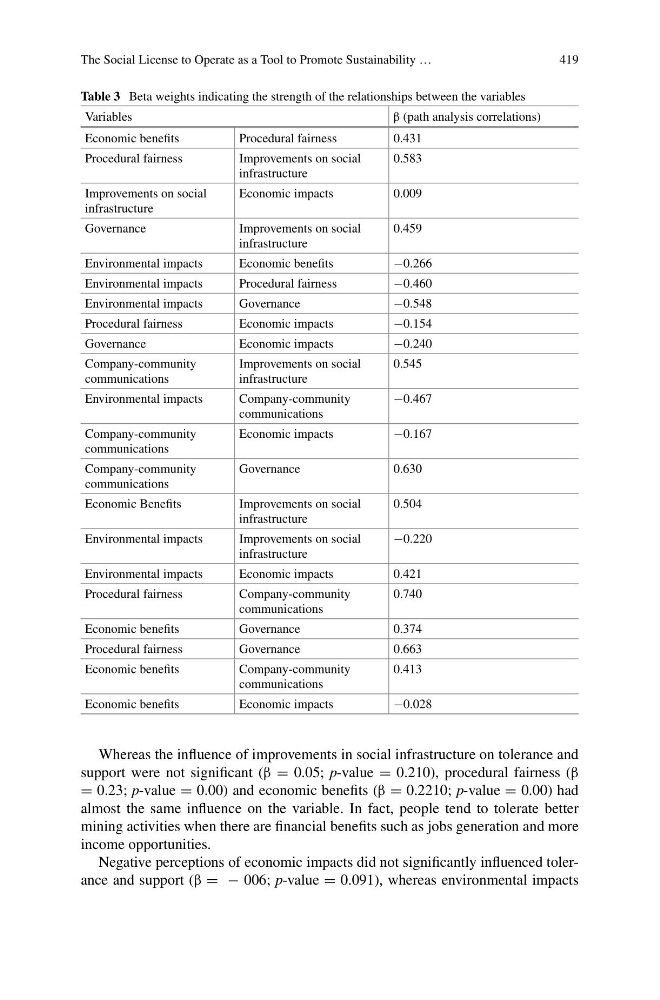
Table 3 Beta weights indicating the strength of the relationships between the variables
Variables
β (path analysis correlations)
Economic benefits
Procedural fairness
0.431
Procedural fairness
Improvements on social
infrastructure
0.583
Improvements on social
infrastructure
Economic impacts
0.009
Governance
Improvements on social
infrastructure
0.459
Environmental impacts
Economic benefits
−0.266
Environmental impacts
Procedural fairness
−0.460
Environmental impacts
Governance
−0.548
Procedural fairness
Economic impacts
−0.154
Governance
Economic impacts
−0.240
Company-community
communications
Improvements on social
infrastructure
0.545
Environmental impacts
Company-community
communications
−0.467
Company-community
communications
Economic impacts
−0.167
Company-community
communications
Governance
0.630
Economic Benefits
Improvements on social
infrastructure
0.504
Environmental impacts
Improvements on social
infrastructure
−0.220
Environmental impacts
Economic impacts
0.421
Procedural fairness
Company-community
communications
0.740
Economic benefits
Governance
0.374
Procedural fairness
Governance
0.663
Economic benefits
Company-community
communications
0.413
Economic benefits
Economic impacts
−0.028
Whereas the influence of improvements in social infrastructure on tolerance and
support were not significant (β = 0.05; p-value = 0.210), procedural fairness (β
= 0.23; p-value = 0.00) and economic benefits (β = 0.2210; p-value = 0.00) had
almost the same influence on the variable. In fact, people tend to tolerate better
mining activities when there are financial benefits such as jobs generation and more
income opportunities.
Negative perceptions of economic impacts did not significantly influenced tolerance and support (β = − 006; p-value = 0.091), whereas environmental impacts
419
Table 3 Beta weights indicating the strength of the relationships between the variables
Variables
β (path analysis correlations)
Economic benefits
Procedural fairness
0.431
Procedural fairness
Improvements on social
infrastructure
0.583
Improvements on social
infrastructure
Economic impacts
0.009
Governance
Improvements on social
infrastructure
0.459
Environmental impacts
Economic benefits
−0.266
Environmental impacts
Procedural fairness
−0.460
Environmental impacts
Governance
−0.548
Procedural fairness
Economic impacts
−0.154
Governance
Economic impacts
−0.240
Company-community
communications
Improvements on social
infrastructure
0.545
Environmental impacts
Company-community
communications
−0.467
Company-community
communications
Economic impacts
−0.167
Company-community
communications
Governance
0.630
Economic Benefits
Improvements on social
infrastructure
0.504
Environmental impacts
Improvements on social
infrastructure
−0.220
Environmental impacts
Economic impacts
0.421
Procedural fairness
Company-community
communications
0.740
Economic benefits
Governance
0.374
Procedural fairness
Governance
0.663
Economic benefits
Company-community
communications
0.413
Economic benefits
Economic impacts
−0.028
Whereas the influence of improvements in social infrastructure on tolerance and
support were not significant (β = 0.05; p-value = 0.210), procedural fairness (β
= 0.23; p-value = 0.00) and economic benefits (β = 0.2210; p-value = 0.00) had
almost the same influence on the variable. In fact, people tend to tolerate better
mining activities when there are financial benefits such as jobs generation and more
income opportunities.
Negative perceptions of economic impacts did not significantly influenced tolerance and support (β = − 006; p-value = 0.091), whereas environmental impacts