

Deployment of Sustainable Development Framework …
139
dependent variables were put in random order and presented on the different pages
of a questionnaire to ensure internal consistency. Hence, in addition to this, the
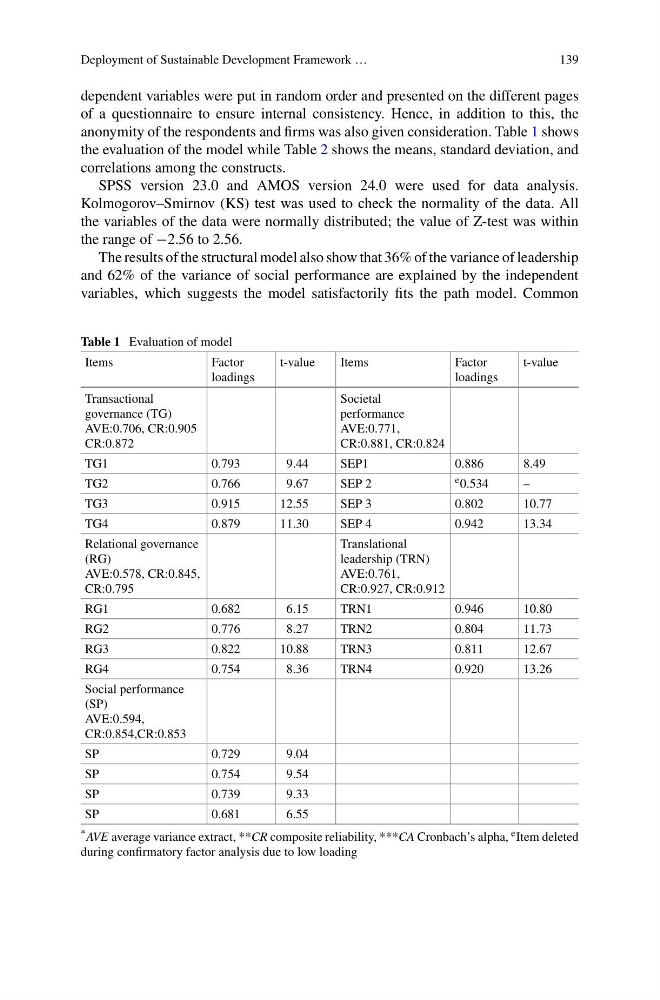
anonymity of the respondents and firms was also given consideration. Table 1 shows
the evaluation of the model while Table 2 shows the means, standard deviation, and
correlations among the constructs.
SPSS version 23.0 and AMOS version 24.0 were used for data analysis.
Kolmogorov–Smirnov (KS) test was used to check the normality of the data. All
the variables of the data were normally distributed; the value of Z-test was within
the range of −2.56 to 2.56.
The results of the structural model also show that 36% of the variance of leadership
and 62% of the variance of social performance are explained by the independent
variables, which suggests the model satisfactorily fits the path model. Common
Table 1 Evaluation of model
Items
Factor
loadings
t-value
Items
Factor
loadings
t-value
Transactional
governance (TG)
AVE:0.706, CR:0.905
CR:0.872
Societal
performance
AVE:0.771,
CR:0.881, CR:0.824
TG1
0.793
9.44
SEP1
0.886
8.49
TG2
0.766
9.67
SEP 2
e 0.534
–
TG3
0.915
12.55
SEP 3
0.802
10.77
TG4
0.879
11.30
SEP 4
0.942
13.34
Relational governance
(RG)
AVE:0.578, CR:0.845,
CR:0.795
Translational
leadership (TRN)
AVE:0.761,
CR:0.927, CR:0.912
RG1
0.682
6.15
TRN1
0.946
10.80
RG2
0.776
8.27
TRN2
0.804
11.73
RG3
0.822
10.88
TRN3
0.811
12.67
RG4
0.754
8.36
TRN4
0.920
13.26
Social performance
(SP)
AVE:0.594,
CR:0.854,CR:0.853
SP
0.729
9.04
SP
0.754
9.54
SP
0.739
9.33
SP
0.681
6.55
* AVE average variance extract, **CR composite reliability, ***CA Cronbach’s alpha, e Item deleted
during confirmatory factor analysis due to low loading
139
dependent variables were put in random order and presented on the different pages
of a questionnaire to ensure internal consistency. Hence, in addition to this, the
anonymity of the respondents and firms was also given consideration. Table 1 shows
the evaluation of the model while Table 2 shows the means, standard deviation, and
correlations among the constructs.
SPSS version 23.0 and AMOS version 24.0 were used for data analysis.
Kolmogorov–Smirnov (KS) test was used to check the normality of the data. All
the variables of the data were normally distributed; the value of Z-test was within
the range of −2.56 to 2.56.
The results of the structural model also show that 36% of the variance of leadership
and 62% of the variance of social performance are explained by the independent
variables, which suggests the model satisfactorily fits the path model. Common
Table 1 Evaluation of model
Items
Factor
loadings
t-value
Items
Factor
loadings
t-value
Transactional
governance (TG)
AVE:0.706, CR:0.905
CR:0.872
Societal
performance
AVE:0.771,
CR:0.881, CR:0.824
TG1
0.793
9.44
SEP1
0.886
8.49
TG2
0.766
9.67
SEP 2
e 0.534
–
TG3
0.915
12.55
SEP 3
0.802
10.77
TG4
0.879
11.30
SEP 4
0.942
13.34
Relational governance
(RG)
AVE:0.578, CR:0.845,
CR:0.795
Translational
leadership (TRN)
AVE:0.761,
CR:0.927, CR:0.912
RG1
0.682
6.15
TRN1
0.946
10.80
RG2
0.776
8.27
TRN2
0.804
11.73
RG3
0.822
10.88
TRN3
0.811
12.67
RG4
0.754
8.36
TRN4
0.920
13.26
Social performance
(SP)
AVE:0.594,
CR:0.854,CR:0.853
SP
0.729
9.04
SP
0.754
9.54
SP
0.739
9.33
SP
0.681
6.55
* AVE average variance extract, **CR composite reliability, ***CA Cronbach’s alpha, e Item deleted
during confirmatory factor analysis due to low loading