

140
U. Awan et al.
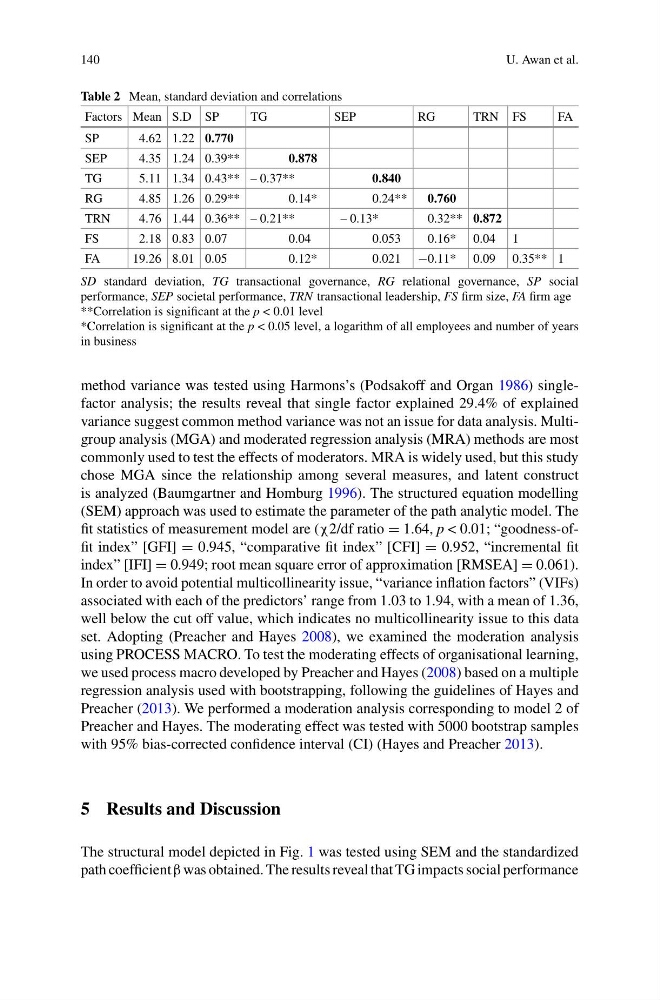
Table 2 Mean, standard deviation and correlations
Factors Mean S.D SP
TG
SEP
RG
TRN FS
FA
SP
4.62 1.22 0.770
SEP
4.35 1.24 0.39**
0.878
TG
5.11 1.34 0.43** – 0.37**
0.840
RG
4.85 1.26 0.29**
0.14*
0.24**
0.760
TRN
4.76 1.44 0.36** – 0.21**
– 0.13*
0.32** 0.872
FS
2.18 0.83 0.07
0.04
0.053
0.16* 0.04 1
FA
19.26 8.01 0.05
0.12*
0.021 −0.11* 0.09 0.35** 1
SD standard deviation, TG transactional governance, RG relational governance, SP social
performance, SEP societal performance, TRN transactional leadership, FS firm size, FA firm age
**Correlation is significant at the p < 0.01 level
*Correlation is significant at the p < 0.05 level, a logarithm of all employees and number of years
in business
method variance was tested using Harmons’s (Podsakoff and Organ 1986) singlefactor analysis; the results reveal that single factor explained 29.4% of explained
variance suggest common method variance was not an issue for data analysis. Multigroup analysis (MGA) and moderated regression analysis (MRA) methods are most
commonly used to test the effects of moderators. MRA is widely used, but this study
chose MGA since the relationship among several measures, and latent construct
is analyzed (Baumgartner and Homburg 1996). The structured equation modelling
(SEM) approach was used to estimate the parameter of the path analytic model. The
fit statistics of measurement model are (χ2/df ratio = 1.64, p < 0.01; “goodness-offit index” [GFI] = 0.945, “comparative fit index” [CFI] = 0.952, “incremental fit
index” [IFI] = 0.949; root mean square error of approximation [RMSEA] = 0.061).
In order to avoid potential multicollinearity issue, “variance inflation factors” (VIFs)
associated with each of the predictors’ range from 1.03 to 1.94, with a mean of 1.36,
well below the cut off value, which indicates no multicollinearity issue to this data
set. Adopting (Preacher and Hayes 2008), we examined the moderation analysis
using PROCESS MACRO. To test the moderating effects of organisational learning,
we used process macro developed by Preacher and Hayes (2008) based on a multiple
regression analysis used with bootstrapping, following the guidelines of Hayes and
Preacher (2013). We performed a moderation analysis corresponding to model 2 of
Preacher and Hayes. The moderating effect was tested with 5000 bootstrap samples
with 95% bias-corrected confidence interval (CI) (Hayes and Preacher 2013).
5 Results and Discussion
The structural model depicted in Fig. 1 was tested using SEM and the standardized
path coefficient β was obtained. The results reveal that TG impacts social performance
U. Awan et al.
Table 2 Mean, standard deviation and correlations
Factors Mean S.D SP
TG
SEP
RG
TRN FS
FA
SP
4.62 1.22 0.770
SEP
4.35 1.24 0.39**
0.878
TG
5.11 1.34 0.43** – 0.37**
0.840
RG
4.85 1.26 0.29**
0.14*
0.24**
0.760
TRN
4.76 1.44 0.36** – 0.21**
– 0.13*
0.32** 0.872
FS
2.18 0.83 0.07
0.04
0.053
0.16* 0.04 1
FA
19.26 8.01 0.05
0.12*
0.021 −0.11* 0.09 0.35** 1
SD standard deviation, TG transactional governance, RG relational governance, SP social
performance, SEP societal performance, TRN transactional leadership, FS firm size, FA firm age
**Correlation is significant at the p < 0.01 level
*Correlation is significant at the p < 0.05 level, a logarithm of all employees and number of years
in business
method variance was tested using Harmons’s (Podsakoff and Organ 1986) singlefactor analysis; the results reveal that single factor explained 29.4% of explained
variance suggest common method variance was not an issue for data analysis. Multigroup analysis (MGA) and moderated regression analysis (MRA) methods are most
commonly used to test the effects of moderators. MRA is widely used, but this study
chose MGA since the relationship among several measures, and latent construct
is analyzed (Baumgartner and Homburg 1996). The structured equation modelling
(SEM) approach was used to estimate the parameter of the path analytic model. The
fit statistics of measurement model are (χ2/df ratio = 1.64, p < 0.01; “goodness-offit index” [GFI] = 0.945, “comparative fit index” [CFI] = 0.952, “incremental fit
index” [IFI] = 0.949; root mean square error of approximation [RMSEA] = 0.061).
In order to avoid potential multicollinearity issue, “variance inflation factors” (VIFs)
associated with each of the predictors’ range from 1.03 to 1.94, with a mean of 1.36,
well below the cut off value, which indicates no multicollinearity issue to this data
set. Adopting (Preacher and Hayes 2008), we examined the moderation analysis
using PROCESS MACRO. To test the moderating effects of organisational learning,
we used process macro developed by Preacher and Hayes (2008) based on a multiple
regression analysis used with bootstrapping, following the guidelines of Hayes and
Preacher (2013). We performed a moderation analysis corresponding to model 2 of
Preacher and Hayes. The moderating effect was tested with 5000 bootstrap samples
with 95% bias-corrected confidence interval (CI) (Hayes and Preacher 2013).
5 Results and Discussion
The structural model depicted in Fig. 1 was tested using SEM and the standardized
path coefficient β was obtained. The results reveal that TG impacts social performance