

Frequency (cm −1 )
0.2
0.4
0.6
0.8
1
1.2
1.4
1.6
Frequency (THz)
(a)
Frequency (cm
−1 )
10
30
50
70
90
110
130
250
Water + protein
10 K
T
DNA
300 K
200
G
150
C
100
50
A
A (×3)
0
0.5 1.0 1.5 2.0 2.5 3.0 3.5 4.0
Frequency (THz)
(b)
(c)
10
20
400
300
Segelstein et al. (1981)
Venables et al. (2000)
Thrane et al. (1995)
Jepsen et al. (2007)
Hasted et al. (1987)
Barthel et al. (1990)
μ
a
>
200
100
300
200
100
H
H
H
H
O
O
O
O
O
H
H
H H
H H
δ
−
δ
+
Tetrahedral arrangement of
intermolecular hydrogen bonds
0
30
50
40
ε[cm
−1
M
−1
]
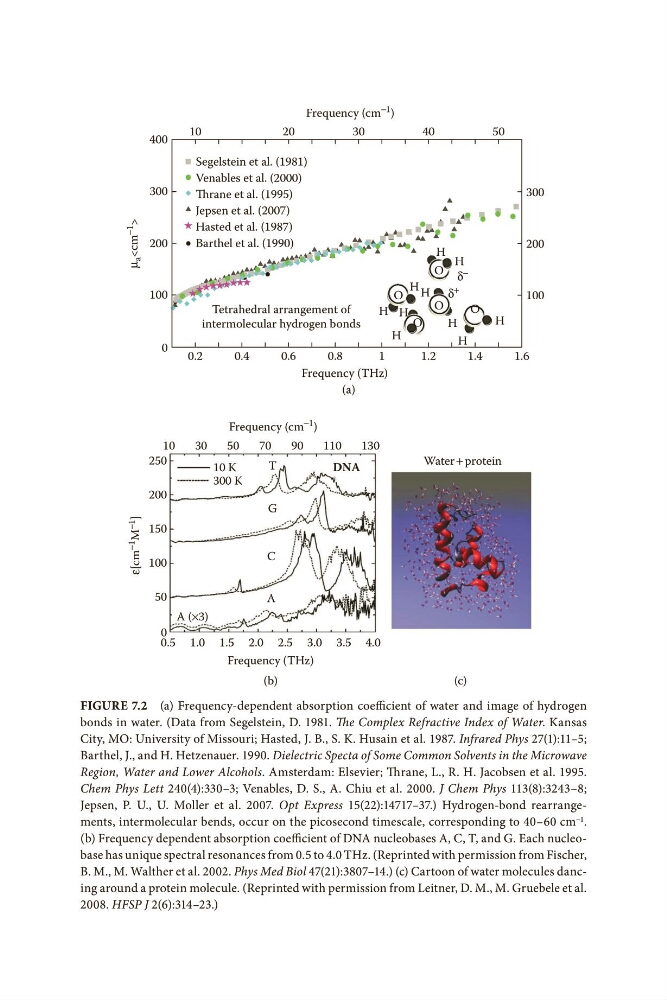
Figure 7.2 (a) Frequency-dependent absorption coefficient of water and image of hydrogen
bonds in water. (Data from Segelstein, D. 1981. The Complex Refractive Index of Water. Kansas
City, MO: University of Missouri; Hasted, J. B., S. K. Husain et al. 1987. Infrared Phys 27(1):11–5;
Barthel, J., and H. Hetzenauer. 1990. Dielectric Specta of Some Common Solvents in the Microwave
Region, Water and Lower Alcohols. Amsterdam: Elsevier; Thrane, L., R. H. Jacobsen et al. 1995.
Chem Phys Lett 240(4):330–3; Venables, D. S., A. Chiu et al. 2000. J Chem Phys 113(8):3243–8;
Jepsen, P. U., U. Moller et al. 2007. Opt Express 15(22):14717–37.) Hydrogen-bond rearrangements, intermolecular bends, occur on the picosecond timescale, corresponding to 40–60 cm −1 .
(b) Frequency dependent absorption coefficient of DNA nucleobases A, C, T, and G. Each nucleobase has unique spectral resonances from 0.5 to 4.0 THz. (Reprinted with permission from Fischer,
B. M., M. Walther et al. 2002. Phys Med Biol 47(21):3807–14.) (c) Cartoon of water molecules dancing around a protein molecule. (Reprinted with permission from Leitner, D. M., M. Gruebele et al.
2008. HFSP J 2(6):314–23.)
0.2
0.4
0.6
0.8
1
1.2
1.4
1.6
Frequency (THz)
(a)
Frequency (cm
−1 )
10
30
50
70
90
110
130
250
Water + protein
10 K
T
DNA
300 K
200
G
150
C
100
50
A
A (×3)
0
0.5 1.0 1.5 2.0 2.5 3.0 3.5 4.0
Frequency (THz)
(b)
(c)
10
20
400
300
Segelstein et al. (1981)
Venables et al. (2000)
Thrane et al. (1995)
Jepsen et al. (2007)
Hasted et al. (1987)
Barthel et al. (1990)
μ
a
>
200
100
300
200
100
H
H
H
H
O
O
O
O
O
H
H
H H
H H
δ
−
δ
+
Tetrahedral arrangement of
intermolecular hydrogen bonds
0
30
50
40
ε[cm
−1
M
−1
]
Figure 7.2 (a) Frequency-dependent absorption coefficient of water and image of hydrogen
bonds in water. (Data from Segelstein, D. 1981. The Complex Refractive Index of Water. Kansas
City, MO: University of Missouri; Hasted, J. B., S. K. Husain et al. 1987. Infrared Phys 27(1):11–5;
Barthel, J., and H. Hetzenauer. 1990. Dielectric Specta of Some Common Solvents in the Microwave
Region, Water and Lower Alcohols. Amsterdam: Elsevier; Thrane, L., R. H. Jacobsen et al. 1995.
Chem Phys Lett 240(4):330–3; Venables, D. S., A. Chiu et al. 2000. J Chem Phys 113(8):3243–8;
Jepsen, P. U., U. Moller et al. 2007. Opt Express 15(22):14717–37.) Hydrogen-bond rearrangements, intermolecular bends, occur on the picosecond timescale, corresponding to 40–60 cm −1 .
(b) Frequency dependent absorption coefficient of DNA nucleobases A, C, T, and G. Each nucleobase has unique spectral resonances from 0.5 to 4.0 THz. (Reprinted with permission from Fischer,
B. M., M. Walther et al. 2002. Phys Med Biol 47(21):3807–14.) (c) Cartoon of water molecules dancing around a protein molecule. (Reprinted with permission from Leitner, D. M., M. Gruebele et al.
2008. HFSP J 2(6):314–23.)