

302
Electromagnetic Fields in Biological Systems
with the highest exposure is the ipsilateral (same) side of the brain as used during
the call. However, when the cellular phone is mounted on another part of the body
(e.g., chest, waist, hip), that anatomical area receives the highest RF exposure (Mild and
Wilen 2009).
For example, in the study by Kang and Gandhi (2002), the 1 and 10 g avg peak SAR
values for four typical cellular phones operating at 835 and 1900 MHz were calculated,
assumed as though they were placed in a shirt pocket. Several clothing thicknesses were
taken into account. It was found that both the 1 and 10 g avg peak SAR values reduced
monotonically with increasing separation from the phantom. Moreover, it was found
that the SAR values in the chest when the telephones are placed with the antennas closer
to the body (“back” position) could be up to 2.1 times higher at 835 MHz and up to
5.8 times higher at 1900 MHz with respect to the SAR values found when the antennas
are placed far from the body (“front” position). Similarly, in the research of Manning
and Gabriel (2000) it was shown that if the cellular phone is in a pocket, there will be a
lower body dose by ensuring that the keypad of the phone is facing the body.
In the study by Han et al. (2006), the SAR distribution in a human body model exposed
to the EM field radiated by a 2400 MHz planar-inverted-F antenna (PIFA) used in a
Bluetooth device and located right before the user’s chest was examined. As expected,
the highest SAR areas were found to be at the body surface near the antenna. The
10 g avg peak SAR of lung, small intestine, and blood were found to be comparatively
high. However, for all cases under consideration, and assuming an antenna output power
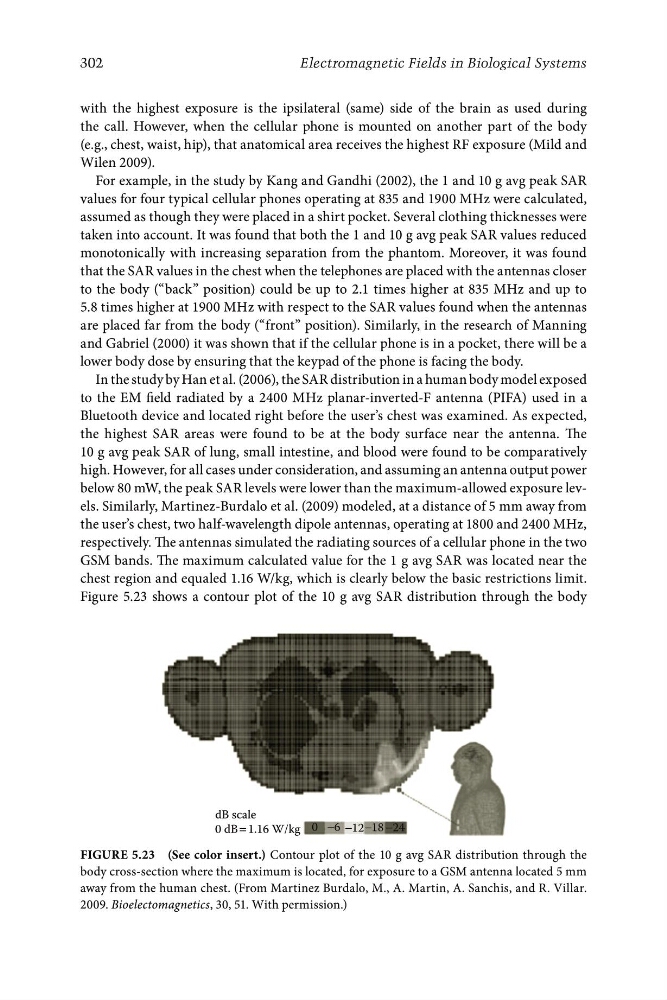
below 80 mW, the peak SAR levels were lower than the maximum-allowed exposure levels. Similarly, Martinez-Burdalo et al. (2009) modeled, at a distance of 5 mm away from
the user’s chest, two half-wavelength dipole antennas, operating at 1800 and 2400 MHz,
respectively. The antennas simulated the radiating sources of a cellular phone in the two
GSM bands. The maximum calculated value for the 1 g avg SAR was located near the
chest region and equaled 1.16 W/kg, which is clearly below the basic restrictions limit.
Figure 5.23 shows a contour plot of the 10 g avg SAR distribution through the body
dB scale
0 dB = 1.16 W/kg 0 −6 −12−18 −24
Figure 5.23 (See color insert.) Contour plot of the 10 g avg SAR distribution through the
body cross-section where the maximum is located, for exposure to a GSM antenna located 5 mm
away from the human chest. (From Martinez Burdalo, M., A. Martin, A. Sanchis, and R. Villar.
2009. Bioelectomagnetics, 30, 51. With permission.)
Electromagnetic Fields in Biological Systems
with the highest exposure is the ipsilateral (same) side of the brain as used during
the call. However, when the cellular phone is mounted on another part of the body
(e.g., chest, waist, hip), that anatomical area receives the highest RF exposure (Mild and
Wilen 2009).
For example, in the study by Kang and Gandhi (2002), the 1 and 10 g avg peak SAR
values for four typical cellular phones operating at 835 and 1900 MHz were calculated,
assumed as though they were placed in a shirt pocket. Several clothing thicknesses were
taken into account. It was found that both the 1 and 10 g avg peak SAR values reduced
monotonically with increasing separation from the phantom. Moreover, it was found
that the SAR values in the chest when the telephones are placed with the antennas closer
to the body (“back” position) could be up to 2.1 times higher at 835 MHz and up to
5.8 times higher at 1900 MHz with respect to the SAR values found when the antennas
are placed far from the body (“front” position). Similarly, in the research of Manning
and Gabriel (2000) it was shown that if the cellular phone is in a pocket, there will be a
lower body dose by ensuring that the keypad of the phone is facing the body.
In the study by Han et al. (2006), the SAR distribution in a human body model exposed
to the EM field radiated by a 2400 MHz planar-inverted-F antenna (PIFA) used in a
Bluetooth device and located right before the user’s chest was examined. As expected,
the highest SAR areas were found to be at the body surface near the antenna. The
10 g avg peak SAR of lung, small intestine, and blood were found to be comparatively
high. However, for all cases under consideration, and assuming an antenna output power
below 80 mW, the peak SAR levels were lower than the maximum-allowed exposure levels. Similarly, Martinez-Burdalo et al. (2009) modeled, at a distance of 5 mm away from
the user’s chest, two half-wavelength dipole antennas, operating at 1800 and 2400 MHz,
respectively. The antennas simulated the radiating sources of a cellular phone in the two
GSM bands. The maximum calculated value for the 1 g avg SAR was located near the
chest region and equaled 1.16 W/kg, which is clearly below the basic restrictions limit.
Figure 5.23 shows a contour plot of the 10 g avg SAR distribution through the body
dB scale
0 dB = 1.16 W/kg 0 −6 −12−18 −24
Figure 5.23 (See color insert.) Contour plot of the 10 g avg SAR distribution through the
body cross-section where the maximum is located, for exposure to a GSM antenna located 5 mm
away from the human chest. (From Martinez Burdalo, M., A. Martin, A. Sanchis, and R. Villar.
2009. Bioelectomagnetics, 30, 51. With permission.)