

Table 5.6 10 g avg SAR in the Head of Two Anatomical
Models (Duke and Billie) from a Cellular Phone Connected
to a Hands-Free Device at 900 MHz
10 g avg SAR (W/kg)
Handset Position
Orientation
Duke
Billie
Pants pocket
Back side
0.045
0.036
Front side
0.004
0.04
Shirt pocket
Back side
0.366
0.039
Front side
0.006
0.016
Source: Data from Kuhn, S. et al. 2009. Phys Med Biol 54:5493–508.
300
Electromagnetic Fields in Biological Systems
0 −10 −20 −30 −40 [dB]
(b)
(a)
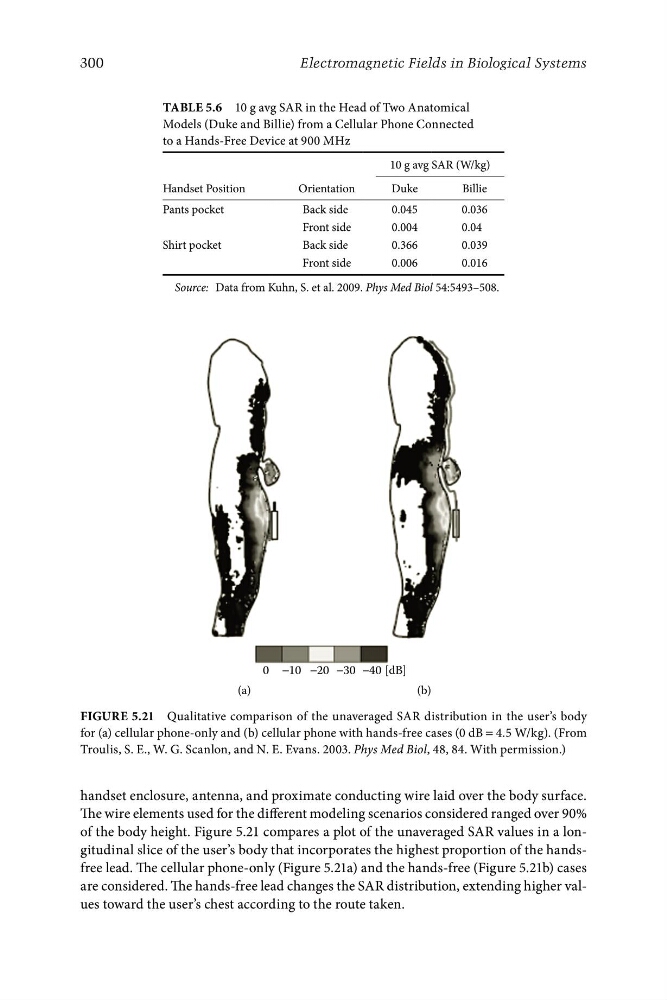
Figure 5.21 Qualitative comparison of the unaveraged SAR distribution in the user’s body
for (a) cellular phone-only and (b) cellular phone with hands-free cases (0 dB = 4.5 W/kg). (From
Troulis, S. E., W. G. Scanlon, and N. E. Evans. 2003. Phys Med Biol, 48, 84. With permission.)
handset enclosure, antenna, and proximate conducting wire laid over the body surface.
The wire elements used for the different modeling scenarios considered ranged over 90%
of the body height. Figure 5.21 compares a plot of the unaveraged SAR values in a longitudinal slice of the user’s body that incorporates the highest proportion of the handsfree lead. The cellular phone-only (Figure 5.21a) and the hands-free (Figure 5.21b) cases
are considered. The hands-free lead changes the SAR distribution, extending higher values toward the user’s chest according to the route taken.
Models (Duke and Billie) from a Cellular Phone Connected
to a Hands-Free Device at 900 MHz
10 g avg SAR (W/kg)
Handset Position
Orientation
Duke
Billie
Pants pocket
Back side
0.045
0.036
Front side
0.004
0.04
Shirt pocket
Back side
0.366
0.039
Front side
0.006
0.016
Source: Data from Kuhn, S. et al. 2009. Phys Med Biol 54:5493–508.
300
Electromagnetic Fields in Biological Systems
0 −10 −20 −30 −40 [dB]
(b)
(a)
Figure 5.21 Qualitative comparison of the unaveraged SAR distribution in the user’s body
for (a) cellular phone-only and (b) cellular phone with hands-free cases (0 dB = 4.5 W/kg). (From
Troulis, S. E., W. G. Scanlon, and N. E. Evans. 2003. Phys Med Biol, 48, 84. With permission.)
handset enclosure, antenna, and proximate conducting wire laid over the body surface.
The wire elements used for the different modeling scenarios considered ranged over 90%
of the body height. Figure 5.21 compares a plot of the unaveraged SAR values in a longitudinal slice of the user’s body that incorporates the highest proportion of the handsfree lead. The cellular phone-only (Figure 5.21a) and the hands-free (Figure 5.21b) cases
are considered. The hands-free lead changes the SAR distribution, extending higher values toward the user’s chest according to the route taken.