

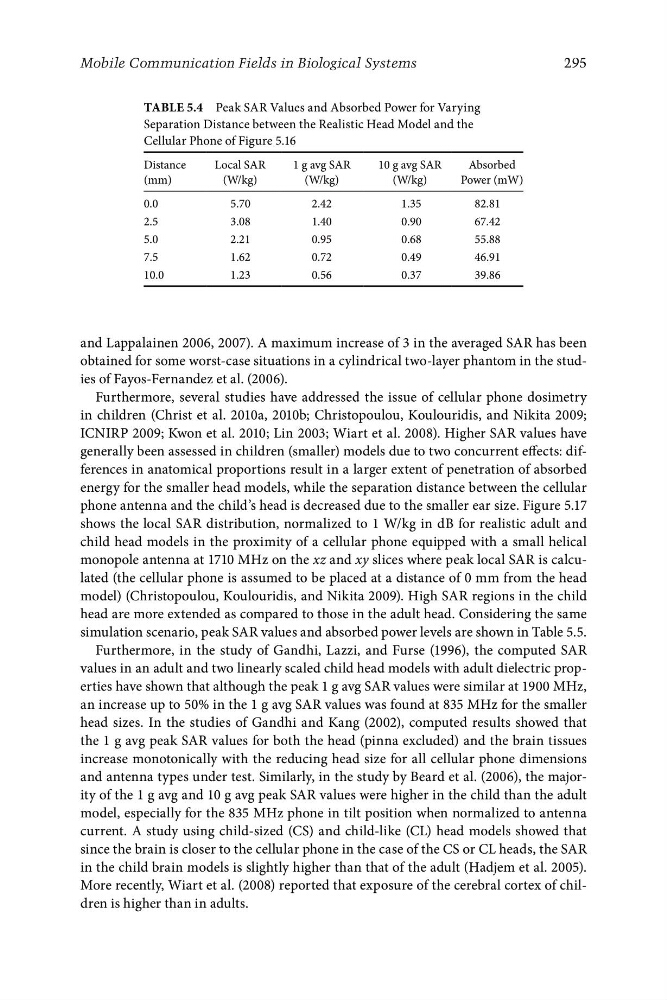
Table 5.4 Peak SAR Values and Absorbed Power for Varying
Separation Distance between the Realistic Head Model and the
Cellular Phone of Figure 5.16
Distance
Local SAR
1 g avg SAR
10 g avg SAR
Absorbed
(mm)
(W/kg)
(W/kg)
(W/kg)
Power (mW)
0.0
5.70
2.42
1.35
82.81
2.5
3.08
1.40
0.90
67.42
5.0
2.21
0.95
0.68
55.88
7.5
1.62
0.72
0.49
46.91
10.0
1.23
0.56
0.37
39.86
295
Mobile Communication Fields in Biological Systems
and Lappalainen 2006, 2007). A maximum increase of 3 in the averaged SAR has been
obtained for some worst-case situations in a cylindrical two-layer phantom in the studies of Fayos-Fernandez et al. (2006).
Furthermore, several studies have addressed the issue of cellular phone dosimetry
in children (Christ et al. 2010a, 2010b; Christopoulou, Koulouridis, and Nikita 2009;
ICNIRP 2009; Kwon et al. 2010; Lin 2003; Wiart et al. 2008). Higher SAR values have
generally been assessed in children (smaller) models due to two concurrent effects: differences in anatomical proportions result in a larger extent of penetration of absorbed
energy for the smaller head models, while the separation distance between the cellular
phone antenna and the child’s head is decreased due to the smaller ear size. Figure 5.17
shows the local SAR distribution, normalized to 1 W/kg in dB for realistic adult and
child head models in the proximity of a cellular phone equipped with a small helical
monopole antenna at 1710 MHz on the xz and xy slices where peak local SAR is calculated (the cellular phone is assumed to be placed at a distance of 0 mm from the head
model) (Christopoulou, Koulouridis, and Nikita 2009). High SAR regions in the child
head are more extended as compared to those in the adult head. Considering the same
simulation scenario, peak SAR values and absorbed power levels are shown in Table 5.5.
Furthermore, in the study of Gandhi, Lazzi, and Furse (1996), the computed SAR
values in an adult and two linearly scaled child head models with adult dielectric properties have shown that although the peak 1 g avg SAR values were similar at 1900 MHz,
an increase up to 50% in the 1 g avg SAR values was found at 835 MHz for the smaller
head sizes. In the studies of Gandhi and Kang (2002), computed results showed that
the 1 g avg peak SAR values for both the head (pinna excluded) and the brain tissues
increase monotonically with the reducing head size for all cellular phone dimensions
and antenna types under test. Similarly, in the study by Beard et al. (2006), the majority of the 1 g avg and 10 g avg peak SAR values were higher in the child than the adult
model, especially for the 835 MHz phone in tilt position when normalized to antenna
current. A study using child-sized (CS) and child-like (CL) head models showed that
since the brain is closer to the cellular phone in the case of the CS or CL heads, the SAR
in the child brain models is slightly higher than that of the adult (Hadjem et al. 2005).
More recently, Wiart et al. (2008) reported that exposure of the cerebral cortex of children is higher than in adults.
Separation Distance between the Realistic Head Model and the
Cellular Phone of Figure 5.16
Distance
Local SAR
1 g avg SAR
10 g avg SAR
Absorbed
(mm)
(W/kg)
(W/kg)
(W/kg)
Power (mW)
0.0
5.70
2.42
1.35
82.81
2.5
3.08
1.40
0.90
67.42
5.0
2.21
0.95
0.68
55.88
7.5
1.62
0.72
0.49
46.91
10.0
1.23
0.56
0.37
39.86
295
Mobile Communication Fields in Biological Systems
and Lappalainen 2006, 2007). A maximum increase of 3 in the averaged SAR has been
obtained for some worst-case situations in a cylindrical two-layer phantom in the studies of Fayos-Fernandez et al. (2006).
Furthermore, several studies have addressed the issue of cellular phone dosimetry
in children (Christ et al. 2010a, 2010b; Christopoulou, Koulouridis, and Nikita 2009;
ICNIRP 2009; Kwon et al. 2010; Lin 2003; Wiart et al. 2008). Higher SAR values have
generally been assessed in children (smaller) models due to two concurrent effects: differences in anatomical proportions result in a larger extent of penetration of absorbed
energy for the smaller head models, while the separation distance between the cellular
phone antenna and the child’s head is decreased due to the smaller ear size. Figure 5.17
shows the local SAR distribution, normalized to 1 W/kg in dB for realistic adult and
child head models in the proximity of a cellular phone equipped with a small helical
monopole antenna at 1710 MHz on the xz and xy slices where peak local SAR is calculated (the cellular phone is assumed to be placed at a distance of 0 mm from the head
model) (Christopoulou, Koulouridis, and Nikita 2009). High SAR regions in the child
head are more extended as compared to those in the adult head. Considering the same
simulation scenario, peak SAR values and absorbed power levels are shown in Table 5.5.
Furthermore, in the study of Gandhi, Lazzi, and Furse (1996), the computed SAR
values in an adult and two linearly scaled child head models with adult dielectric properties have shown that although the peak 1 g avg SAR values were similar at 1900 MHz,
an increase up to 50% in the 1 g avg SAR values was found at 835 MHz for the smaller
head sizes. In the studies of Gandhi and Kang (2002), computed results showed that
the 1 g avg peak SAR values for both the head (pinna excluded) and the brain tissues
increase monotonically with the reducing head size for all cellular phone dimensions
and antenna types under test. Similarly, in the study by Beard et al. (2006), the majority of the 1 g avg and 10 g avg peak SAR values were higher in the child than the adult
model, especially for the 835 MHz phone in tilt position when normalized to antenna
current. A study using child-sized (CS) and child-like (CL) head models showed that
since the brain is closer to the cellular phone in the case of the CS or CL heads, the SAR
in the child brain models is slightly higher than that of the adult (Hadjem et al. 2005).
More recently, Wiart et al. (2008) reported that exposure of the cerebral cortex of children is higher than in adults.