

z
z
y
y
x
z
y
x
x
z
y
x
0
−10
−20
−30
−40
−50
dB
(a)
(b)
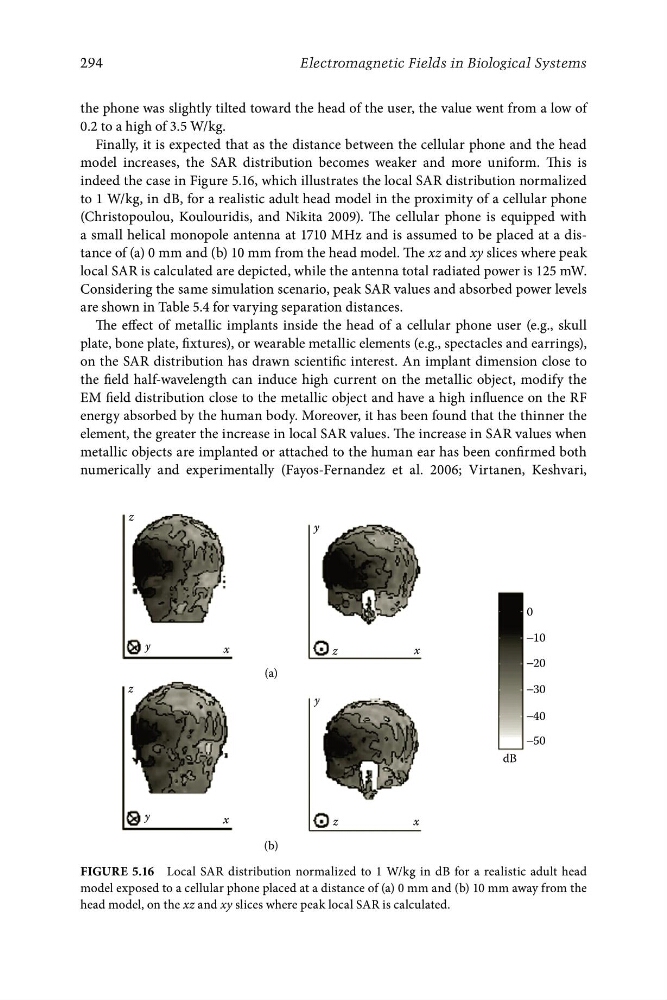
Figure 5.16 Local SAR distribution normalized to 1 W/kg in dB for a realistic adult head
model exposed to a cellular phone placed at a distance of (a) 0 mm and (b) 10 mm away from the
294
Electromagnetic Fields in Biological Systems
the phone was slightly tilted toward the head of the user, the value went from a low of
0.2 to a high of 3.5 W/kg.
Finally, it is expected that as the distance between the cellular phone and the head
model increases, the SAR distribution becomes weaker and more uniform. This is
indeed the case in Figure 5.16, which illustrates the local SAR distribution normalized
to 1 W/kg, in dB, for a realistic adult head model in the proximity of a cellular phone
(Christopoulou, Koulouridis, and Nikita 2009). The cellular phone is equipped with
a small helical monopole antenna at 1710 MHz and is assumed to be placed at a distance of (a) 0 mm and (b) 10 mm from the head model. The xz and xy slices where peak
local SAR is calculated are depicted, while the antenna total radiated power is 125 mW.
Considering the same simulation scenario, peak SAR values and absorbed power levels
are shown in Table 5.4 for varying separation distances.
The effect of metallic implants inside the head of a cellular phone user (e.g., skull
plate, bone plate, fixtures), or wearable metallic elements (e.g., spectacles and earrings),
on the SAR distribution has drawn scientific interest. An implant dimension close to
the field half-wavelength can induce high current on the metallic object, modify the
EM field distribution close to the metallic object and have a high influence on the RF
energy absorbed by the human body. Moreover, it has been found that the thinner the
element, the greater the increase in local SAR values. The increase in SAR values when
metallic objects are implanted or attached to the human ear has been confirmed both
numerically and experimentally (Fayos-Fernandez et al. 2006; Virtanen, Keshvari,
head model, on the xz and xy slices where peak local SAR is calculated.
z
y
y
x
z
y
x
x
z
y
x
0
−10
−20
−30
−40
−50
dB
(a)
(b)
Figure 5.16 Local SAR distribution normalized to 1 W/kg in dB for a realistic adult head
model exposed to a cellular phone placed at a distance of (a) 0 mm and (b) 10 mm away from the
294
Electromagnetic Fields in Biological Systems
the phone was slightly tilted toward the head of the user, the value went from a low of
0.2 to a high of 3.5 W/kg.
Finally, it is expected that as the distance between the cellular phone and the head
model increases, the SAR distribution becomes weaker and more uniform. This is
indeed the case in Figure 5.16, which illustrates the local SAR distribution normalized
to 1 W/kg, in dB, for a realistic adult head model in the proximity of a cellular phone
(Christopoulou, Koulouridis, and Nikita 2009). The cellular phone is equipped with
a small helical monopole antenna at 1710 MHz and is assumed to be placed at a distance of (a) 0 mm and (b) 10 mm from the head model. The xz and xy slices where peak
local SAR is calculated are depicted, while the antenna total radiated power is 125 mW.
Considering the same simulation scenario, peak SAR values and absorbed power levels
are shown in Table 5.4 for varying separation distances.
The effect of metallic implants inside the head of a cellular phone user (e.g., skull
plate, bone plate, fixtures), or wearable metallic elements (e.g., spectacles and earrings),
on the SAR distribution has drawn scientific interest. An implant dimension close to
the field half-wavelength can induce high current on the metallic object, modify the
EM field distribution close to the metallic object and have a high influence on the RF
energy absorbed by the human body. Moreover, it has been found that the thinner the
element, the greater the increase in local SAR values. The increase in SAR values when
metallic objects are implanted or attached to the human ear has been confirmed both
numerically and experimentally (Fayos-Fernandez et al. 2006; Virtanen, Keshvari,
head model, on the xz and xy slices where peak local SAR is calculated.