

Maximum SAR (W/kg)
Maximum SAR = f (radiating element)
Local SAR (adult) Local SAR (child) 1 g SAR (adult)
1 g SAR (child)
10 g SAR (adult)
10 g SAR (child)
6
5,70
5,14
5
4
3,51
3
2,42
2,23
2,20
2
1
1,31 1,05
0,74 0,73
1,35 1,45
0
Linear
Helical
Radiating element
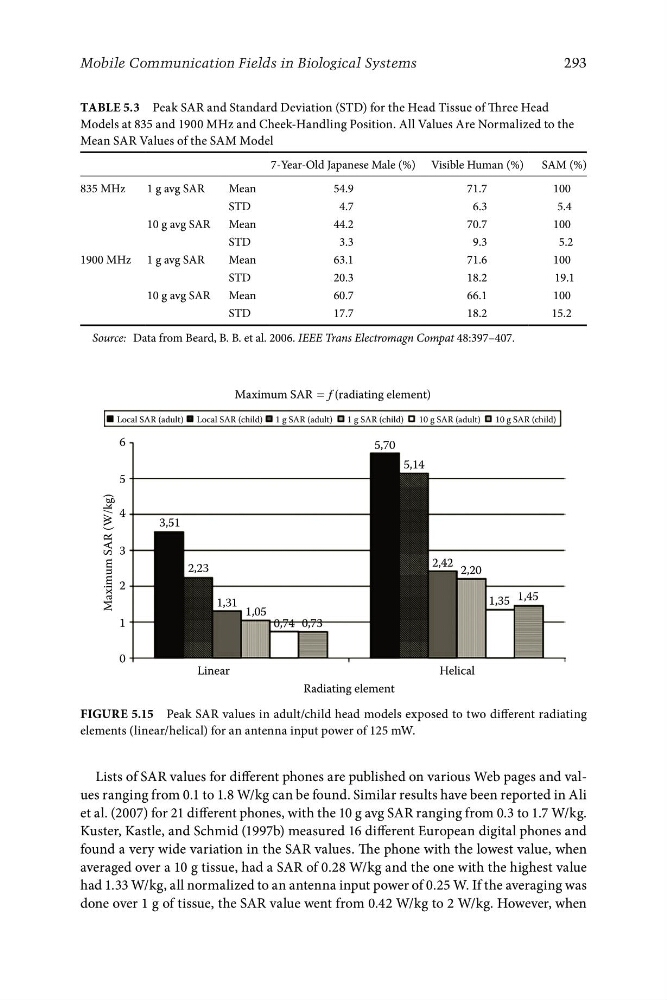
Figure 5.15 Peak SAR values in adult/child head models exposed to two different radiating
elements (linear/helical) for an antenna input power of 125 mW.
Table 5.3 Peak SAR and Standard Deviation (STD) for the Head Tissue of Three Head
Models at 835 and 1900 MHz and Cheek-Handling Position. All Values Are Normalized to the
Mean SAR Values of the SAM Model
7-Year-Old Japanese Male (%) Visible Human (%) SAM (%)
835 MHz
1 g avg SAR
Mean
54.9
71.7
100
STD
4.7
6.3
5.4
10 g avg SAR
Mean
44.2
70.7
100
STD
3.3
9.3
5.2
1900 MHz 1 g avg SAR
Mean
63.1
71.6
100
STD
20.3
18.2
19.1
10 g avg SAR
Mean
60.7
66.1
100
STD
17.7
18.2
15.2
Source: Data from Beard, B. B. et al. 2006. IEEE Trans Electromagn Compat 48:397–407.
293
Mobile Communication Fields in Biological Systems
Lists of SAR values for different phones are published on various Web pages and values ranging from 0.1 to 1.8 W/kg can be found. Similar results have been reported in Ali
et al. (2007) for 21 different phones, with the 10 g avg SAR ranging from 0.3 to 1.7 W/kg.
Kuster, Kastle, and Schmid (1997b) measured 16 different European digital phones and
found a very wide variation in the SAR values. The phone with the lowest value, when
averaged over a 10 g tissue, had a SAR of 0.28 W/kg and the one with the highest value
had 1.33 W/kg, all normalized to an antenna input power of 0.25 W. If the averaging was
done over 1 g of tissue, the SAR value went from 0.42 W/kg to 2 W/kg. However, when
Maximum SAR = f (radiating element)
Local SAR (adult) Local SAR (child) 1 g SAR (adult)
1 g SAR (child)
10 g SAR (adult)
10 g SAR (child)
6
5,70
5,14
5
4
3,51
3
2,42
2,23
2,20
2
1
1,31 1,05
0,74 0,73
1,35 1,45
0
Linear
Helical
Radiating element
Figure 5.15 Peak SAR values in adult/child head models exposed to two different radiating
elements (linear/helical) for an antenna input power of 125 mW.
Table 5.3 Peak SAR and Standard Deviation (STD) for the Head Tissue of Three Head
Models at 835 and 1900 MHz and Cheek-Handling Position. All Values Are Normalized to the
Mean SAR Values of the SAM Model
7-Year-Old Japanese Male (%) Visible Human (%) SAM (%)
835 MHz
1 g avg SAR
Mean
54.9
71.7
100
STD
4.7
6.3
5.4
10 g avg SAR
Mean
44.2
70.7
100
STD
3.3
9.3
5.2
1900 MHz 1 g avg SAR
Mean
63.1
71.6
100
STD
20.3
18.2
19.1
10 g avg SAR
Mean
60.7
66.1
100
STD
17.7
18.2
15.2
Source: Data from Beard, B. B. et al. 2006. IEEE Trans Electromagn Compat 48:397–407.
293
Mobile Communication Fields in Biological Systems
Lists of SAR values for different phones are published on various Web pages and values ranging from 0.1 to 1.8 W/kg can be found. Similar results have been reported in Ali
et al. (2007) for 21 different phones, with the 10 g avg SAR ranging from 0.3 to 1.7 W/kg.
Kuster, Kastle, and Schmid (1997b) measured 16 different European digital phones and
found a very wide variation in the SAR values. The phone with the lowest value, when
averaged over a 10 g tissue, had a SAR of 0.28 W/kg and the one with the highest value
had 1.33 W/kg, all normalized to an antenna input power of 0.25 W. If the averaging was
done over 1 g of tissue, the SAR value went from 0.42 W/kg to 2 W/kg. However, when