

292
Electromagnetic Fields in Biological Systems
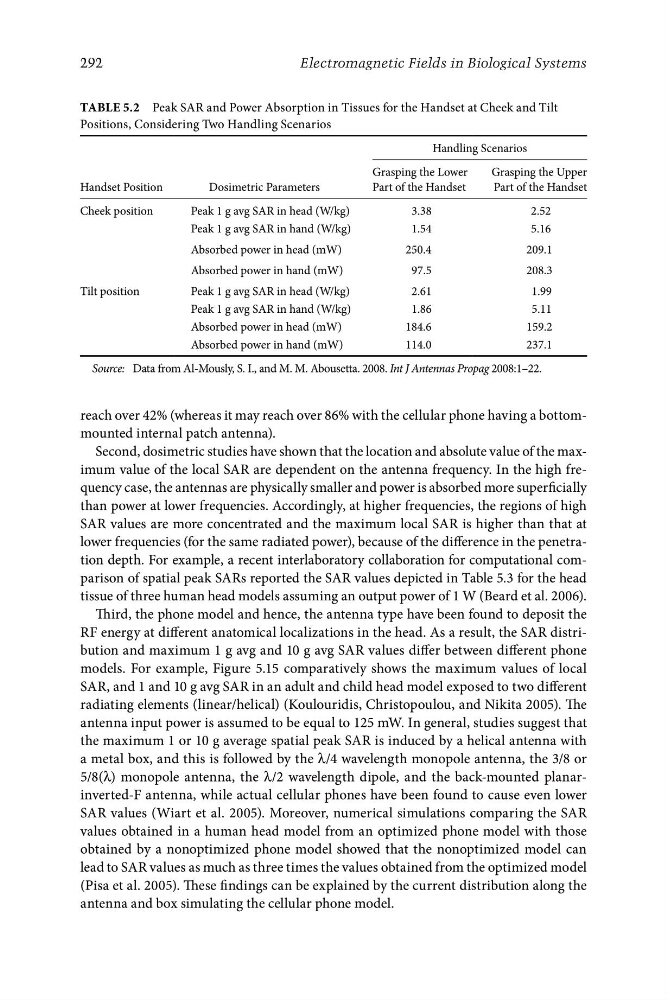
Table 5.2 Peak SAR and Power Absorption in Tissues for the Handset at Cheek and Tilt
Positions, Considering Two Handling Scenarios
Handling Scenarios
Handset Position
Dosimetric Parameters
Grasping the Lower
Part of the Handset
Grasping the Upper
Part of the Handset
Cheek position
Tilt position
Peak 1 g avg SAR in head (W/kg)
Peak 1 g avg SAR in hand (W/kg)
Absorbed power in head (mW)
Absorbed power in hand (mW)
Peak 1 g avg SAR in head (W/kg)
Peak 1 g avg SAR in hand (W/kg)
Absorbed power in head (mW)
Absorbed power in hand (mW)
3.38
1.54
250.4
97.5
2.61
1.86
184.6
114.0
2.52
5.16
209.1
208.3
1.99
5.11
159.2
237.1
Source: Data from Al-Mously, S. I., and M. M. Abousetta. 2008. Int J Antennas Propag 2008:1–22.
reach over 42% (whereas it may reach over 86% with the cellular phone having a bottommounted internal patch antenna).
Second, dosimetric studies have shown that the location and absolute value of the maximum value of the local SAR are dependent on the antenna frequency. In the high frequency case, the antennas are physically smaller and power is absorbed more superficially
than power at lower frequencies. Accordingly, at higher frequencies, the regions of high
SAR values are more concentrated and the maximum local SAR is higher than that at
lower frequencies (for the same radiated power), because of the difference in the penetration depth. For example, a recent interlaboratory collaboration for computational comparison of spatial peak SARs reported the SAR values depicted in Table 5.3 for the head
tissue of three human head models assuming an output power of 1 W (Beard et al. 2006).
Third, the phone model and hence, the antenna type have been found to deposit the
RF energy at different anatomical localizations in the head. As a result, the SAR distribution and maximum 1 g avg and 10 g avg SAR values differ between different phone
models. For example, Figure 5.15 comparatively shows the maximum values of local
SAR, and 1 and 10 g avg SAR in an adult and child head model exposed to two different
radiating elements (linear/helical) (Koulouridis, Christopoulou, and Nikita 2005). The
antenna input power is assumed to be equal to 125 mW. In general, studies suggest that
the maximum 1 or 10 g average spatial peak SAR is induced by a helical antenna with
a metal box, and this is followed by the λ/4 wavelength monopole antenna, the 3/8 or
5/8(λ) monopole antenna, the λ/2 wavelength dipole, and the back-mounted planarinverted-F antenna, while actual cellular phones have been found to cause even lower
SAR values (Wiart et al. 2005). Moreover, numerical simulations comparing the SAR
values obtained in a human head model from an optimized phone model with those
obtained by a nonoptimized phone model showed that the nonoptimized model can
lead to SAR values as much as three times the values obtained from the optimized model
(Pisa et al. 2005). These findings can be explained by the current distribution along the
antenna and box simulating the cellular phone model.
Electromagnetic Fields in Biological Systems
Table 5.2 Peak SAR and Power Absorption in Tissues for the Handset at Cheek and Tilt
Positions, Considering Two Handling Scenarios
Handling Scenarios
Handset Position
Dosimetric Parameters
Grasping the Lower
Part of the Handset
Grasping the Upper
Part of the Handset
Cheek position
Tilt position
Peak 1 g avg SAR in head (W/kg)
Peak 1 g avg SAR in hand (W/kg)
Absorbed power in head (mW)
Absorbed power in hand (mW)
Peak 1 g avg SAR in head (W/kg)
Peak 1 g avg SAR in hand (W/kg)
Absorbed power in head (mW)
Absorbed power in hand (mW)
3.38
1.54
250.4
97.5
2.61
1.86
184.6
114.0
2.52
5.16
209.1
208.3
1.99
5.11
159.2
237.1
Source: Data from Al-Mously, S. I., and M. M. Abousetta. 2008. Int J Antennas Propag 2008:1–22.
reach over 42% (whereas it may reach over 86% with the cellular phone having a bottommounted internal patch antenna).
Second, dosimetric studies have shown that the location and absolute value of the maximum value of the local SAR are dependent on the antenna frequency. In the high frequency case, the antennas are physically smaller and power is absorbed more superficially
than power at lower frequencies. Accordingly, at higher frequencies, the regions of high
SAR values are more concentrated and the maximum local SAR is higher than that at
lower frequencies (for the same radiated power), because of the difference in the penetration depth. For example, a recent interlaboratory collaboration for computational comparison of spatial peak SARs reported the SAR values depicted in Table 5.3 for the head
tissue of three human head models assuming an output power of 1 W (Beard et al. 2006).
Third, the phone model and hence, the antenna type have been found to deposit the
RF energy at different anatomical localizations in the head. As a result, the SAR distribution and maximum 1 g avg and 10 g avg SAR values differ between different phone
models. For example, Figure 5.15 comparatively shows the maximum values of local
SAR, and 1 and 10 g avg SAR in an adult and child head model exposed to two different
radiating elements (linear/helical) (Koulouridis, Christopoulou, and Nikita 2005). The
antenna input power is assumed to be equal to 125 mW. In general, studies suggest that
the maximum 1 or 10 g average spatial peak SAR is induced by a helical antenna with
a metal box, and this is followed by the λ/4 wavelength monopole antenna, the 3/8 or
5/8(λ) monopole antenna, the λ/2 wavelength dipole, and the back-mounted planarinverted-F antenna, while actual cellular phones have been found to cause even lower
SAR values (Wiart et al. 2005). Moreover, numerical simulations comparing the SAR
values obtained in a human head model from an optimized phone model with those
obtained by a nonoptimized phone model showed that the nonoptimized model can
lead to SAR values as much as three times the values obtained from the optimized model
(Pisa et al. 2005). These findings can be explained by the current distribution along the
antenna and box simulating the cellular phone model.