

Table 5.5 Peak SAR Values and Absorbed Power for the Head Models
of Figure 5.17
Head
Local SAR
1 g avg SAR
10 g avg SAR
Absorbed
Model
(W/kg)
(W/kg)
(W/kg)
Power (mW)
Adult
5.70
2.42
1.35
82.81
Child
5.14
2.20
1.45
82.45
296
Electromagnetic Fields in Biological Systems
0
z
−10
y
x
−20
Adult
Child
−30
y
−40
−50
dB
z
x
Adult
Child
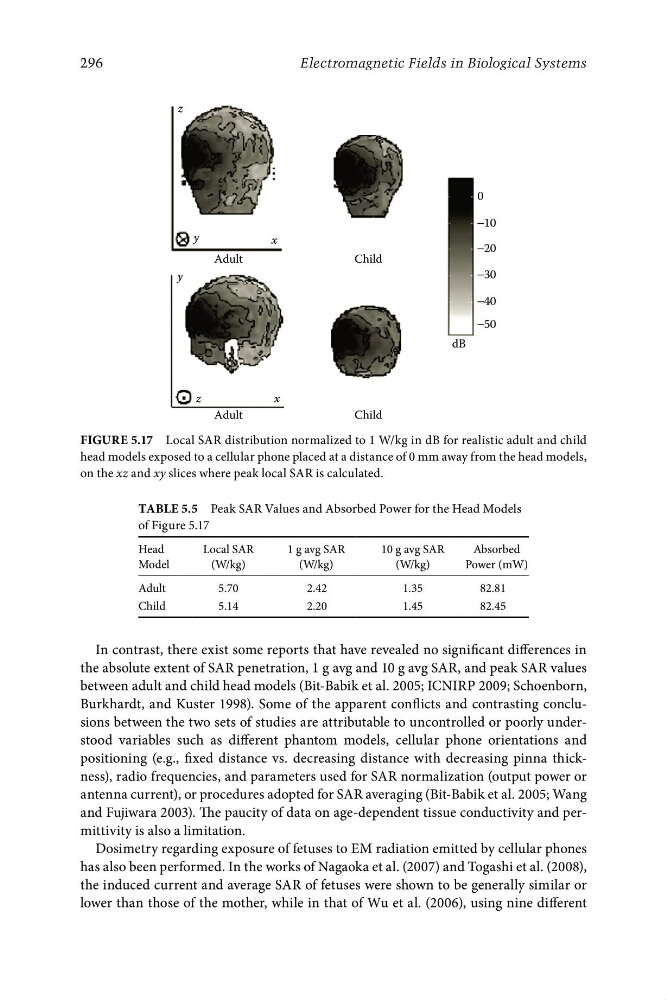
Figure 5.17 Local SAR distribution normalized to 1 W/kg in dB for realistic adult and child
head models exposed to a cellular phone placed at a distance of 0 mm away from the head models,
on the xz and xy slices where peak local SAR is calculated.
In contrast, there exist some reports that have revealed no significant differences in
the absolute extent of SAR penetration, 1 g avg and 10 g avg SAR, and peak SAR values
between adult and child head models (Bit-Babik et al. 2005; ICNIRP 2009; Schoenborn,
Burkhardt, and Kuster 1998). Some of the apparent conflicts and contrasting conclusions between the two sets of studies are attributable to uncontrolled or poorly understood variables such as different phantom models, cellular phone orientations and
positioning (e.g., fixed distance vs. decreasing distance with decreasing pinna thickness), radio frequencies, and parameters used for SAR normalization (output power or
antenna current), or procedures adopted for SAR averaging (Bit-Babik et al. 2005; Wang
and Fujiwara 2003). The paucity of data on age-dependent tissue conductivity and permittivity is also a limitation.
Dosimetry regarding exposure of fetuses to EM radiation emitted by cellular phones
has also been performed. In the works of Nagaoka et al. (2007) and Togashi et al. (2008),
the induced current and average SAR of fetuses were shown to be generally similar or
lower than those of the mother, while in that of Wu et al. (2006), using nine different
of Figure 5.17
Head
Local SAR
1 g avg SAR
10 g avg SAR
Absorbed
Model
(W/kg)
(W/kg)
(W/kg)
Power (mW)
Adult
5.70
2.42
1.35
82.81
Child
5.14
2.20
1.45
82.45
296
Electromagnetic Fields in Biological Systems
0
z
−10
y
x
−20
Adult
Child
−30
y
−40
−50
dB
z
x
Adult
Child
Figure 5.17 Local SAR distribution normalized to 1 W/kg in dB for realistic adult and child
head models exposed to a cellular phone placed at a distance of 0 mm away from the head models,
on the xz and xy slices where peak local SAR is calculated.
In contrast, there exist some reports that have revealed no significant differences in
the absolute extent of SAR penetration, 1 g avg and 10 g avg SAR, and peak SAR values
between adult and child head models (Bit-Babik et al. 2005; ICNIRP 2009; Schoenborn,
Burkhardt, and Kuster 1998). Some of the apparent conflicts and contrasting conclusions between the two sets of studies are attributable to uncontrolled or poorly understood variables such as different phantom models, cellular phone orientations and
positioning (e.g., fixed distance vs. decreasing distance with decreasing pinna thickness), radio frequencies, and parameters used for SAR normalization (output power or
antenna current), or procedures adopted for SAR averaging (Bit-Babik et al. 2005; Wang
and Fujiwara 2003). The paucity of data on age-dependent tissue conductivity and permittivity is also a limitation.
Dosimetry regarding exposure of fetuses to EM radiation emitted by cellular phones
has also been performed. In the works of Nagaoka et al. (2007) and Togashi et al. (2008),
the induced current and average SAR of fetuses were shown to be generally similar or
lower than those of the mother, while in that of Wu et al. (2006), using nine different