

Kc = 4.08, Ti = 26 min, 13 min, 6.5 min
Process Variable
66
64
62
60
58
56
54
52
50
48
46
Ti = 26 min
Ti = 13 min
Ti = 6.5 min
–10
0
10
20
30
40
50
60
70
Time, minutes
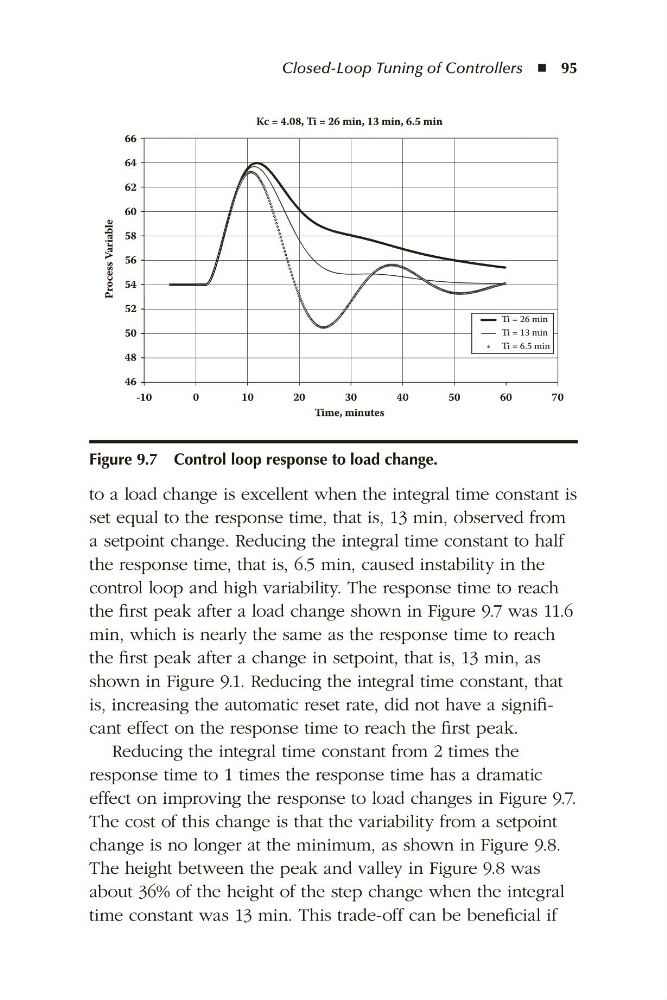
Figure 9.7 Control loop response to load change.
Closed-Loop Tuning of Controllers ◾ 95
to a load change is excellent when the integral time constant is
set equal to the response time, that is, 13 min, observed from
a setpoint change. Reducing the integral time constant to half
the response time, that is, 6.5 min, caused instability in the
control loop and high variability. The response time to reach
the first peak after a load change shown in Figure 9.7 was 11.6
min, which is nearly the same as the response time to reach
the first peak after a change in setpoint, that is, 13 min, as
shown in Figure 9.1. Reducing the integral time constant, that
is, increasing the automatic reset rate, did not have a significant effect on the response time to reach the first peak.
Reducing the integral time constant from 2 times the
response time to 1 times the response time has a dramatic
effect on improving the response to load changes in Figure 9.7.
The cost of this change is that the variability from a setpoint
change is no longer at the minimum, as shown in Figure 9.8.
The height between the peak and valley in Figure 9.8 was
about 36% of the height of the step change when the integral
time constant was 13 min. This trade-off can be beneficial if