

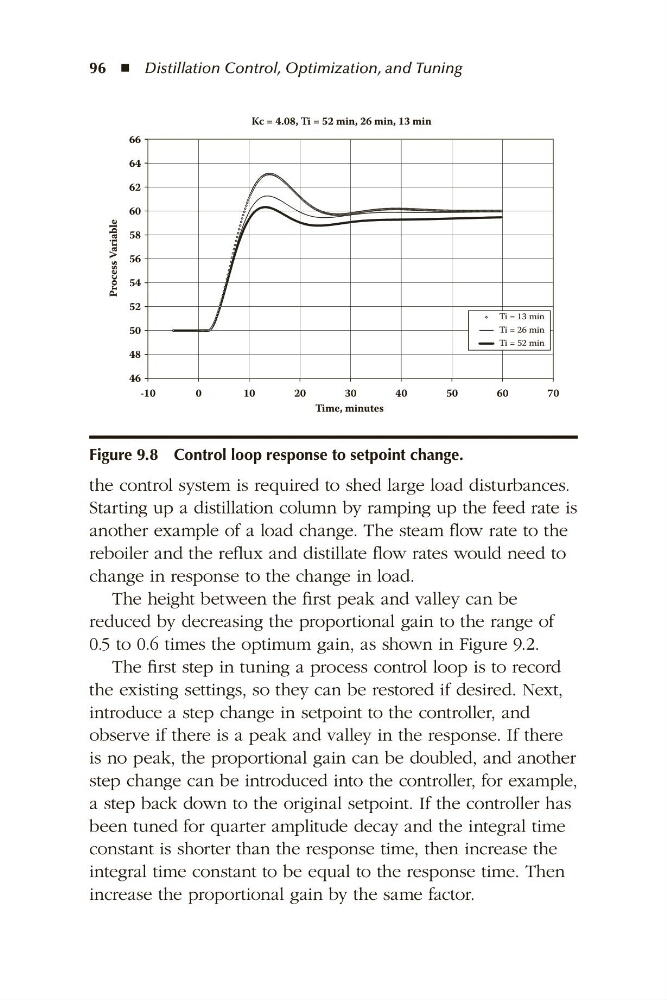
Kc = 4.08, Ti = 52 min, 26 min, 13 min
Process Variable
66
64
62
60
58
56
54
52
50
48
46
Ti = 13 min
Ti = 26 min
Ti = 52 min
–10
0
10
20
30
40
50
60
70
Time, minutes
Figure 9.8 Control loop response to setpoint change.
96 ◾ Distillation Control, Optimization, and Tuning
the control system is required to shed large load disturbances.
Starting up a distillation column by ramping up the feed rate is
another example of a load change. The steam flow rate to the
reboiler and the reflux and distillate flow rates would need to
change in response to the change in load.
The height between the first peak and valley can be
reduced by decreasing the proportional gain to the range of
0.5 to 0.6 times the optimum gain, as shown in Figure 9.2.
The first step in tuning a process control loop is to record
the existing settings, so they can be restored if desired. Next,
introduce a step change in setpoint to the controller, and
observe if there is a peak and valley in the response. If there
is no peak, the proportional gain can be doubled, and another
step change can be introduced into the controller, for example,
a step back down to the original setpoint. If the controller has
been tuned for quarter amplitude decay and the integral time
constant is shorter than the response time, then increase the
integral time constant to be equal to the response time. Then
increase the proportional gain by the same factor.