

Kc = 4.08, Ti = 3.6 minutes
75
200
70
150
Process Variable
Controller Output
–10
0
10
20
30
40
50
60
70
Process Variable
65
100
60
50
55
0
50
–50
Controller Output
45
–100
Time, minutes
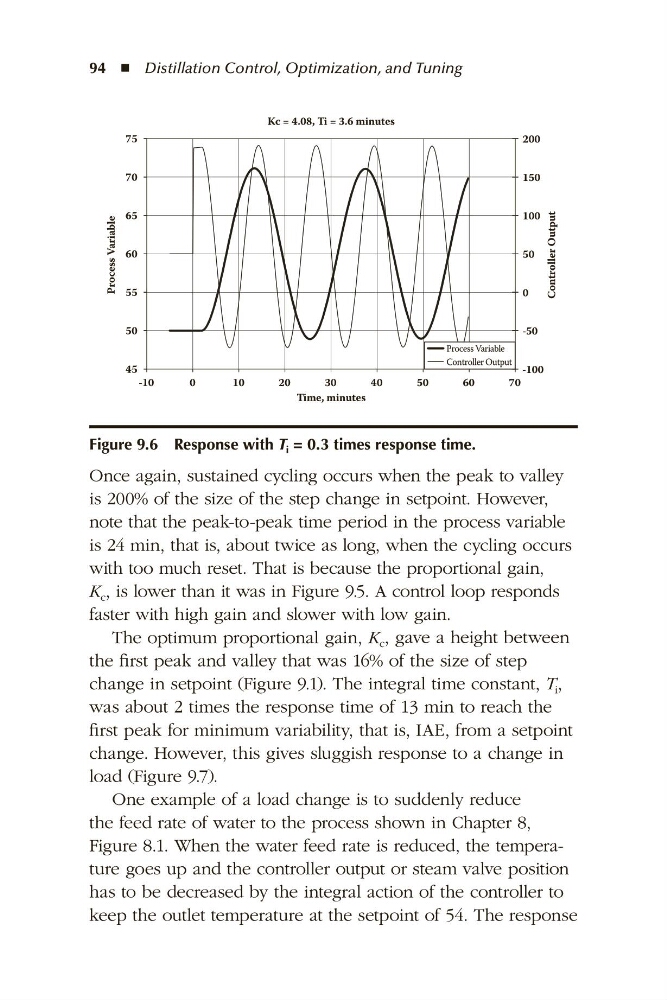
Figure 9.6 Response with T i = 0.3 times response time.
94 ◾ Distillation Control, Optimization, and Tuning
Once again, sustained cycling occurs when the peak to valley
is 200% of the size of the step change in setpoint. However,
note that the peak-to-peak time period in the process variable
is 24 min, that is, about twice as long, when the cycling occurs
with too much reset. That is because the proportional gain,
K c , is lower than it was in Figure 9.5. A control loop responds
faster with high gain and slower with low gain.
The optimum proportional gain, K c , gave a height between
the first peak and valley that was 16% of the size of step
change in setpoint (Figure 9.1). The integral time constant, T i ,
was about 2 times the response time of 13 min to reach the
first peak for minimum variability, that is, IAE, from a setpoint
change. However, this gives sluggish response to a change in
load (Figure 9.7).
One example of a load change is to suddenly reduce
the feed rate of water to the process shown in Chapter 8,
Figure 8.1. When the water feed rate is reduced, the temperature goes up and the controller output or steam valve position
has to be decreased by the integral action of the controller to
keep the outlet temperature at the setpoint of 54. The response