

Kc = 13.79, Ti = 22 minutes
75
200
70
150
Process Variable
Controller Output
–10
0
10
20
30
40
50
60
70
Process Variable
65
100
60
50
55
0
50
–50
Controller Output
45
–100
Time, minutes
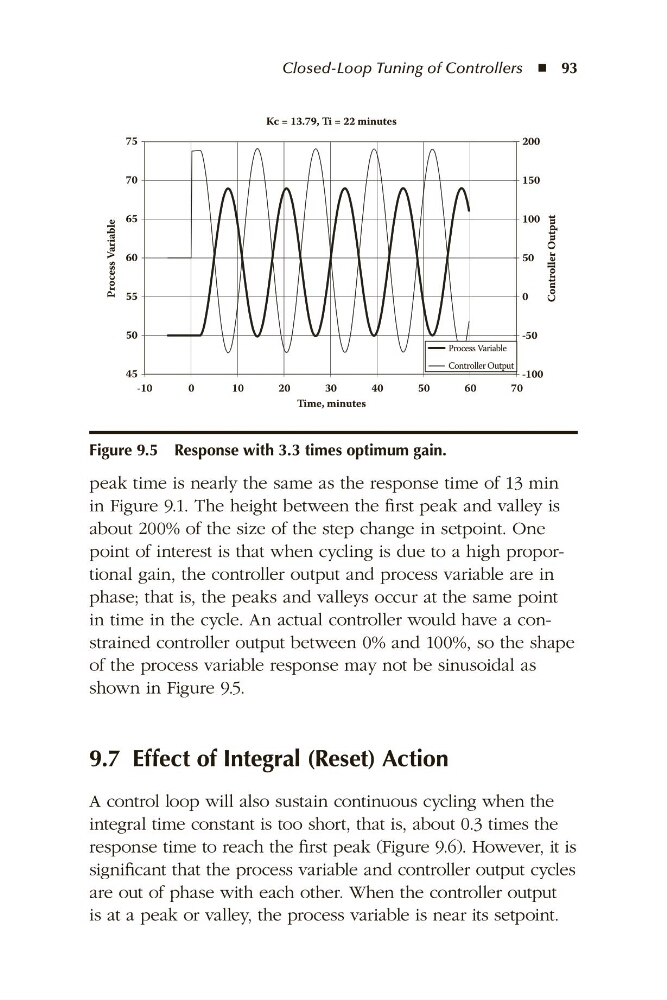
Figure 9.5 Response with 3.3 times optimum gain.
Closed-Loop Tuning of Controllers ◾ 93
peak time is nearly the same as the response time of 13 min
in Figure 9.1. The height between the first peak and valley is
about 200% of the size of the step change in setpoint. One
point of interest is that when cycling is due to a high proportional gain, the controller output and process variable are in
phase; that is, the peaks and valleys occur at the same point
in time in the cycle. An actual controller would have a constrained controller output between 0% and 100%, so the shape
of the process variable response may not be sinusoidal as
shown in Figure 9.5.
9.7 Effect of Integral (Reset) Action
A control loop will also sustain continuous cycling when the
integral time constant is too short, that is, about 0.3 times the
response time to reach the first peak (Figure 9.6). However, it is
significant that the process variable and controller output cycles
are out of phase with each other. When the controller output
is at a peak or valley, the process variable is near its setpoint.