

Kc = 8.16, Ti = 22 minutes
Process Variable
Controller Output
Process Variable
Controller Output
66
64
62
60
58
56
54
52
50
48
46
200
180
160
140
120
100
80
60
40
20
0
–10
0
10
20
30
40
50
60
70
Time, minutes
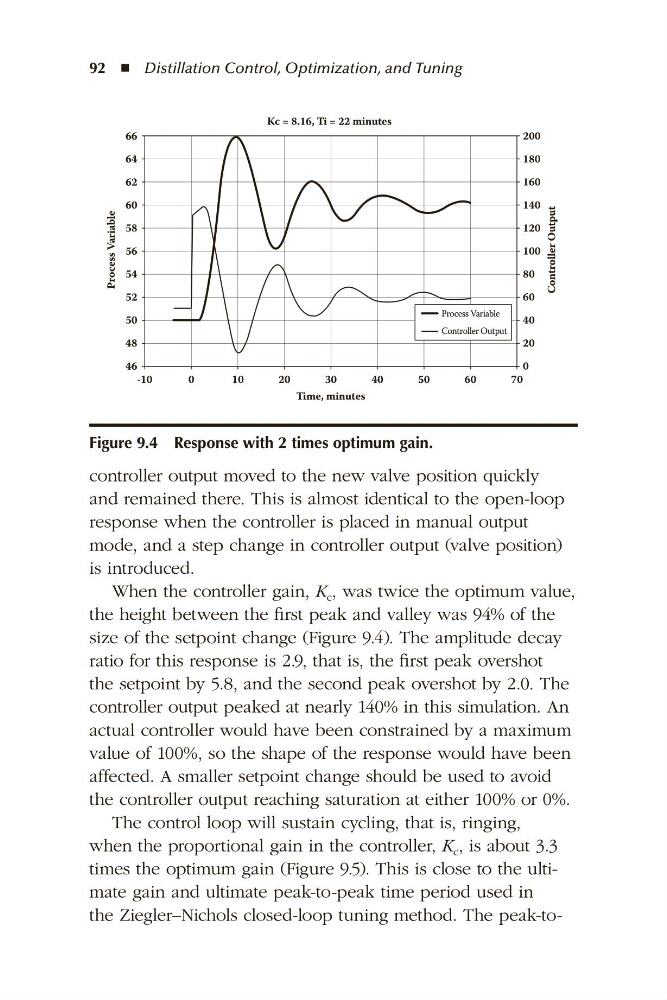
Figure 9.4 Response with 2 times optimum gain.
92 ◾ Distillation Control, Optimization, and Tuning
controller output moved to the new valve position quickly
and remained there. This is almost identical to the open-loop
response when the controller is placed in manual output
mode, and a step change in controller output (valve position)
is introduced.
When the controller gain, K c , was twice the optimum value,
the height between the first peak and valley was 94% of the
size of the setpoint change (Figure 9.4). The amplitude decay
ratio for this response is 2.9, that is, the first peak overshot
the setpoint by 5.8, and the second peak overshot by 2.0. The
controller output peaked at nearly 140% in this simulation. An
actual controller would have been constrained by a maximum
value of 100%, so the shape of the response would have been
affected. A smaller setpoint change should be used to avoid
the controller output reaching saturation at either 100% or 0%.
The control loop will sustain cycling, that is, ringing,
when the proportional gain in the controller, K c , is about 3.3
times the optimum gain (Figure 9.5). This is close to the ultimate gain and ultimate peak-to-peak time period used in
the Ziegler–Nichols closed-loop tuning method. The peak-to