

15.6. QCD corrections to the parton model predictions: scaling violations 145
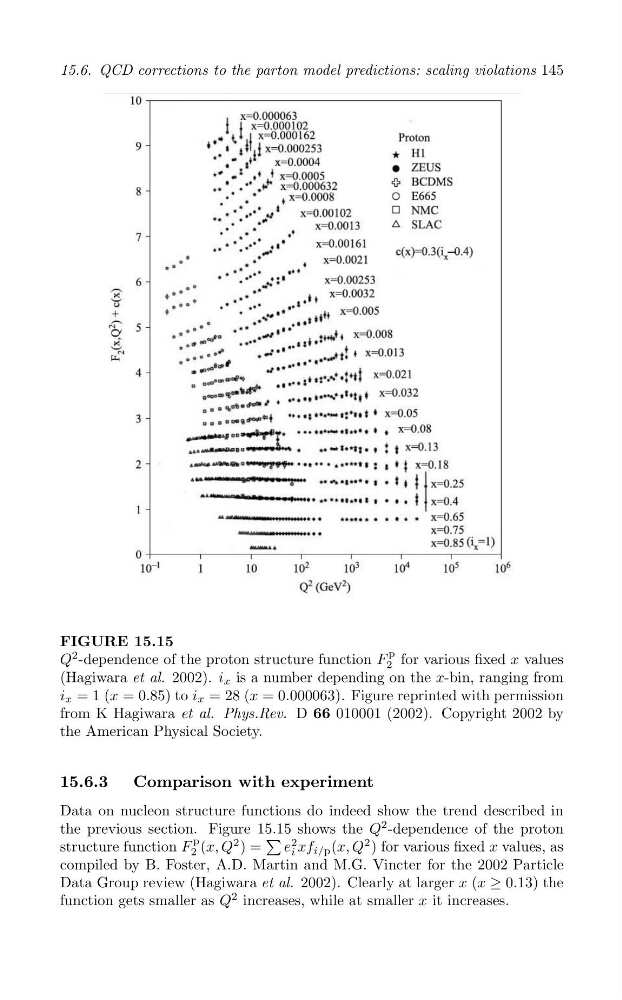
FIGURE 15.15
Q
2 -dependence of the proton structure function F
p
2 for various fixed x values
(Hagiwara et al. 2002). i x is a number depending on the x-bin, ranging from
i x = 1 (x = 0.85) to i x = 28 (x = 0.000063). Figure reprinted with permission
from K Hagiwara et al. Phys.Rev. D 66 010001 (2002). Copyright 2002 by
the American Physical Society.
15.6.3
Comparison with experiment
Data on nucleon structure functions do indeed show the trend described in
the previous section. Figure 15. 15 shows the Q
2 -dependence of the proton
p
structure function F 2 (x, Q
2 ) = e
2
i xf i/p (x, Q
2 ) for various fixed x values, as
compiled by B. Foster, A.D. Martin and M.G. Vincter for the 2002 Particle
Data Group review (Hagiwara et al. 2002). Clearly at larger x (x ≥ 0.13) the
function gets smaller as Q
2 increases, while at smaller x it increases.