

96
14. QCD I: Introduction, Tree Graph Predictions, and Jets
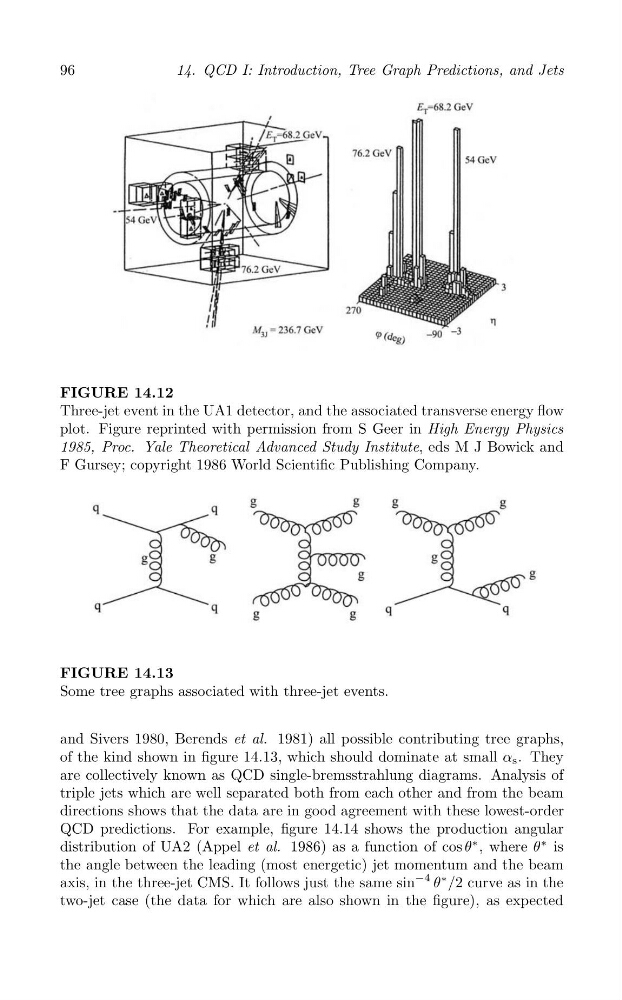
FIGURE 14.12
Three-jet event in the UA1 detector, and the associated transverse energy flow
plot. Figure reprinted with permission from S Geer in High Energy Physics
1985, Proc. Yale Theoretical Advanced Study Institute, eds M J Bowick and
F Gursey; copyright 1986 World Scientific Publishing Company.
FIGURE 14.13
Some tree graphs associated with three-jet events.
and Sivers 1980, Berends et al. 1981) all possible contributing tree graphs,
of the kind shown in figure 14.13, which should dominate at small α s . They
are collectively known as QCD single-bremsstrahlung diagrams. Analysis of
triple jets which are well separated both from each other and from the beam
directions shows that the data are in good agreement with these lowest-order
QCD predictions. For example, figure 14.14 shows the production angular
distribution of UA2 (Appel et al. 1986) as a function of cos θ
∗ , where θ
∗ is
the angle between the leading (most energetic) jet momentum and the beam
axis, in the three-jet CMS. It follows just the same sin
−4 θ
∗ /2 curve as in the
two-jet case (the data for which are also shown in the figure), as expected