

94
14. QCD I: Introduction, Tree Graph Predictions, and Jets
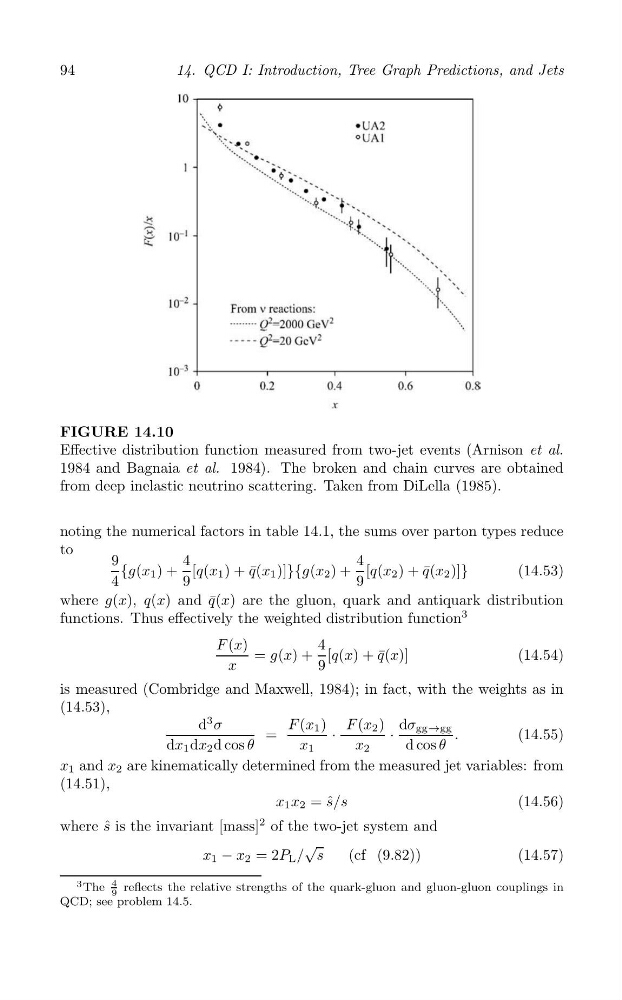
FIGURE 14.10
Effective distribution function measured from two-jet events (Arnison et al.
1984 and Bagnaia et al. 1984). The broken and chain curves are obtained
from deep inelastic neutrino scattering. Taken from DiLella (1985).
noting the numerical factors in table 14.1, the sums over parton types reduce
to
9
4
4
{g(x 1 ) + [q(x 1 ) + q ¯(x 1 )]}{g(x 2 ) + [q(x 2 ) + q ¯(x 2 )]}
(14.53)
4
9
9
where g(x), q(x) and ¯
q(x) are the gluon, quark and antiquark distribution
functions. Thus effectively the weighted distribution function
3
F (x)
4
= g(x) + [q(x) + q ¯(x)]
(14.54)
x
9
is measured (Combridge and Maxwell, 1984); in fact, with the weights as in
(14.53),
d
3 σ
F (x 1 ) F (x 2 ) dσ gg→gg
=
·
·
.
(14.55)
dx 1 dx 2 d cos θ
x 1
x 2
d cos θ
x 1 and x 2 are kinematically determined from the measured jet variables: from
(14.51),
x 1 x 2 = ˆ
s/s
(14.56)
where ˆ
s is the invariant [mass]
2 of the two-jet system and
√
x 1 − x 2 = 2P L / s
(cf (9.82))
(14.57)
4
3 The 9 reflects the relative strengths of the quark-gluon and gluon-gluon couplings in
QCD; see problem 14.5.