

93
14.3. Hard scattering processes, QCD tree graphs, and jets
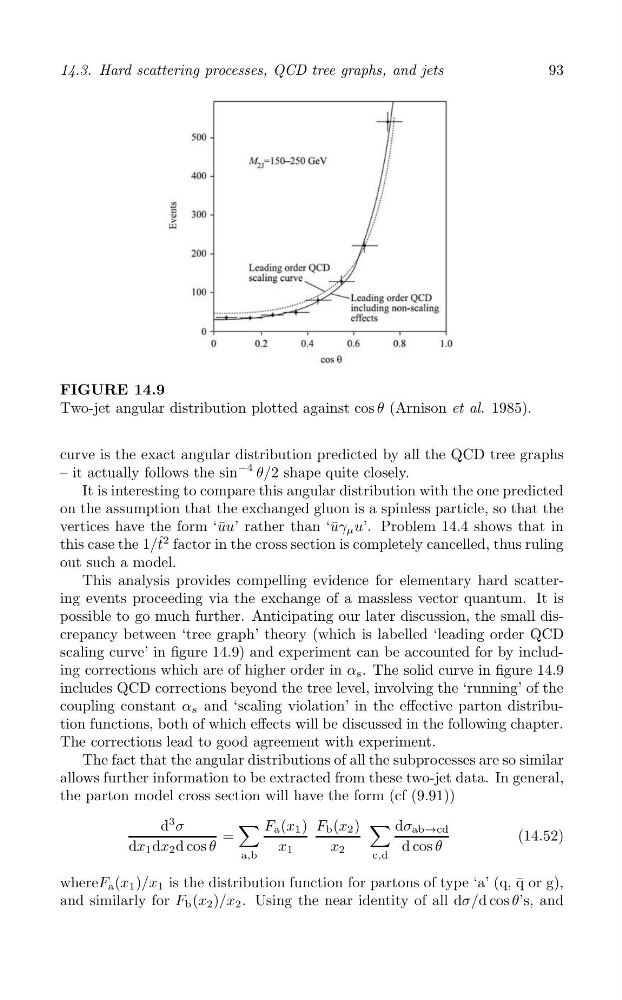
FIGURE 14.9
Two-jet angular distribution plotted against cos θ (Arnison et al. 1985).
curve is the exact angular distribution predicted by all the QCD tree graphs
– it actually follows the sin
−4 θ/2 shape quite closely.
It is interesting to compare this angular distribution with the one predicted
on the assumption that the exchanged gluon is a spinless particle, so that the
vertices have the form ‘¯ uu’ rather than ‘¯ uγ μ u’. Problem 14.4 shows that in
this case the 1/t ˆ 2 factor in the cross section is completely cancelled, thus ruling
out such a model.
This analysis provides compelling evidence for elementary hard scattering events proceeding via the exchange of a massless vector quantum. It is
possible to go much further. Anticipating our later discussion, the small discrepancy between ‘tree graph’ theory (which is labelled ‘leading order QCD
scaling curve’ in figure 14.9) and experiment can be accounted for by including corrections which are of higher order in α s . The solid curve in figure 14.9
includes QCD corrections beyond the tree level, involving the ‘running’ of the
coupling constant α s and ‘scaling violation’ in the effective parton distribution functions, both of which effects will be discussed in the following chapter.
The corrections lead to good agreement with experiment.
The fact that the angular distributions of all the subprocesses are so similar
allows further information to be extracted from these two-jet data. In general,
the parton model cross section will have the form (cf (9.91))
d
3 σ
∑
∑
F a (x 1 ) F b (x 2 )
dσ ab→cd
=
(14.52)
dx 1 dx 2 d cos θ
x 1
x 2
d cos θ
a,b
c,d
whereF a (x 1 )/x 1 is the distribution function for partons of type ‘a’ (q, q or g),
¯
and similarly for F b (x 2 )/x 2 . Using the near identity of all dσ/d cos θ’s, and