

134
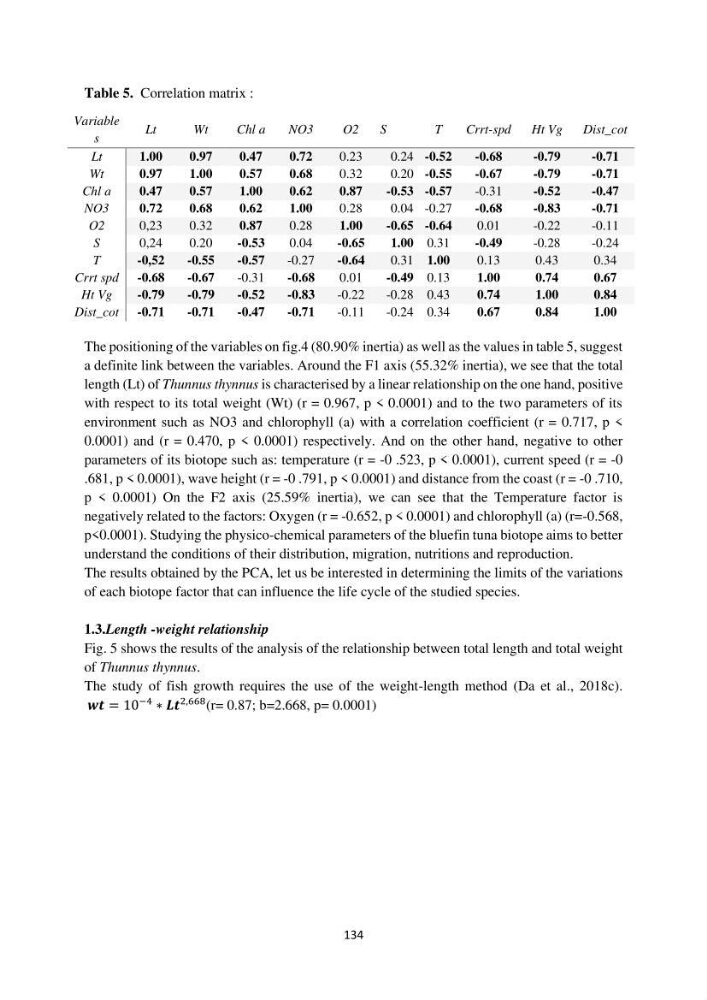
Table 5. Correlation matrix :
Variable
s
Lt
Wt
Chl a
NO3
O2
S
T
Crrt-spd
Ht Vg
Dist_cot
Lt
1.00
0.97
0.47
0.72
0.23
0.24 -0.52
-0.68
-0.79
-0.71
Wt
0.97
1.00
0.57
0.68
0.32
0.20 -0.55
-0.67
-0.79
-0.71
Chl a
0.47
0.57
1.00
0.62
0.87
-0.53 -0.57
-0.31
-0.52
-0.47
NO3
0.72
0.68
0.62
1.00
0.28
0.04 -0.27
-0.68
-0.83
-0.71
O2
0,23
0.32
0.87
0.28
1.00
-0.65 -0.64
0.01
-0.22
-0.11
S
0,24
0.20
-0.53
0.04
-0.65
1.00 0.31
-0.49
-0.28
-0.24
T
-0,52
-0.55
-0.57
-0.27
-0.64
0.31 1.00
0.13
0.43
0.34
Crrt spd -0.68
-0.67
-0.31
-0.68
0.01
-0.49 0.13
1.00
0.74
0.67
Ht Vg
-0.79
-0.79
-0.52
-0.83
-0.22
-0.28 0.43
0.74
1.00
0.84
Dist_cot -0.71
-0.71
-0.47
-0.71
-0.11
-0.24 0.34
0.67
0.84
1.00
The positioning of the variables on fig.4 (80.90% inertia) as well as the values in table 5, suggest
a definite link between the variables. Around the F1 axis (55.32% inertia), we see that the total
length (Lt) of Thunnus thynnus is characterised by a linear relationship on the one hand, positive
with respect to its total weight (Wt) (r = 0.967, p < 0.0001) and to the two parameters of its
environment such as NO3 and chlorophyll (a) with a correlation coefficient (r = 0.717, p <
0.0001) and (r = 0.470, p < 0.0001) respectively. And on the other hand, negative to other
parameters of its biotope such as: temperature (r = -0 .523, p < 0.0001), current speed (r = -0
.681, p < 0.0001), wave height (r = -0 .791, p < 0.0001) and distance from the coast (r = -0 .710,
p < 0.0001) On the F2 axis (25.59% inertia), we can see that the Temperature factor is
negatively related to the factors: Oxygen (r = -0.652, p < 0.0001) and chlorophyll (a) (r=-0.568,
p<0.0001). Studying the physico-chemical parameters of the bluefin tuna biotope aims to better
understand the conditions of their distribution, migration, nutritions and reproduction.
The results obtained by the PCA, let us be interested in determining the limits of the variations
of each biotope factor that can influence the life cycle of the studied species.
1.3.Length -weight relationship
Fig. 5 shows the results of the analysis of the relationship between total length and total weight
of Thunnus thynnus.
The study of fish growth requires the use of the weight-length method (Da et al., 2018c).
í µí²í µí² = 10
−4 ∗ í µí±³í µí²
2,668 (r= 0.87; b=2.668, p= 0.0001)
Table 5. Correlation matrix :
Variable
s
Lt
Wt
Chl a
NO3
O2
S
T
Crrt-spd
Ht Vg
Dist_cot
Lt
1.00
0.97
0.47
0.72
0.23
0.24 -0.52
-0.68
-0.79
-0.71
Wt
0.97
1.00
0.57
0.68
0.32
0.20 -0.55
-0.67
-0.79
-0.71
Chl a
0.47
0.57
1.00
0.62
0.87
-0.53 -0.57
-0.31
-0.52
-0.47
NO3
0.72
0.68
0.62
1.00
0.28
0.04 -0.27
-0.68
-0.83
-0.71
O2
0,23
0.32
0.87
0.28
1.00
-0.65 -0.64
0.01
-0.22
-0.11
S
0,24
0.20
-0.53
0.04
-0.65
1.00 0.31
-0.49
-0.28
-0.24
T
-0,52
-0.55
-0.57
-0.27
-0.64
0.31 1.00
0.13
0.43
0.34
Crrt spd -0.68
-0.67
-0.31
-0.68
0.01
-0.49 0.13
1.00
0.74
0.67
Ht Vg
-0.79
-0.79
-0.52
-0.83
-0.22
-0.28 0.43
0.74
1.00
0.84
Dist_cot -0.71
-0.71
-0.47
-0.71
-0.11
-0.24 0.34
0.67
0.84
1.00
The positioning of the variables on fig.4 (80.90% inertia) as well as the values in table 5, suggest
a definite link between the variables. Around the F1 axis (55.32% inertia), we see that the total
length (Lt) of Thunnus thynnus is characterised by a linear relationship on the one hand, positive
with respect to its total weight (Wt) (r = 0.967, p < 0.0001) and to the two parameters of its
environment such as NO3 and chlorophyll (a) with a correlation coefficient (r = 0.717, p <
0.0001) and (r = 0.470, p < 0.0001) respectively. And on the other hand, negative to other
parameters of its biotope such as: temperature (r = -0 .523, p < 0.0001), current speed (r = -0
.681, p < 0.0001), wave height (r = -0 .791, p < 0.0001) and distance from the coast (r = -0 .710,
p < 0.0001) On the F2 axis (25.59% inertia), we can see that the Temperature factor is
negatively related to the factors: Oxygen (r = -0.652, p < 0.0001) and chlorophyll (a) (r=-0.568,
p<0.0001). Studying the physico-chemical parameters of the bluefin tuna biotope aims to better
understand the conditions of their distribution, migration, nutritions and reproduction.
The results obtained by the PCA, let us be interested in determining the limits of the variations
of each biotope factor that can influence the life cycle of the studied species.
1.3.Length -weight relationship
Fig. 5 shows the results of the analysis of the relationship between total length and total weight
of Thunnus thynnus.
The study of fish growth requires the use of the weight-length method (Da et al., 2018c).
í µí²í µí² = 10
−4 ∗ í µí±³í µí²
2,668 (r= 0.87; b=2.668, p= 0.0001)