

135
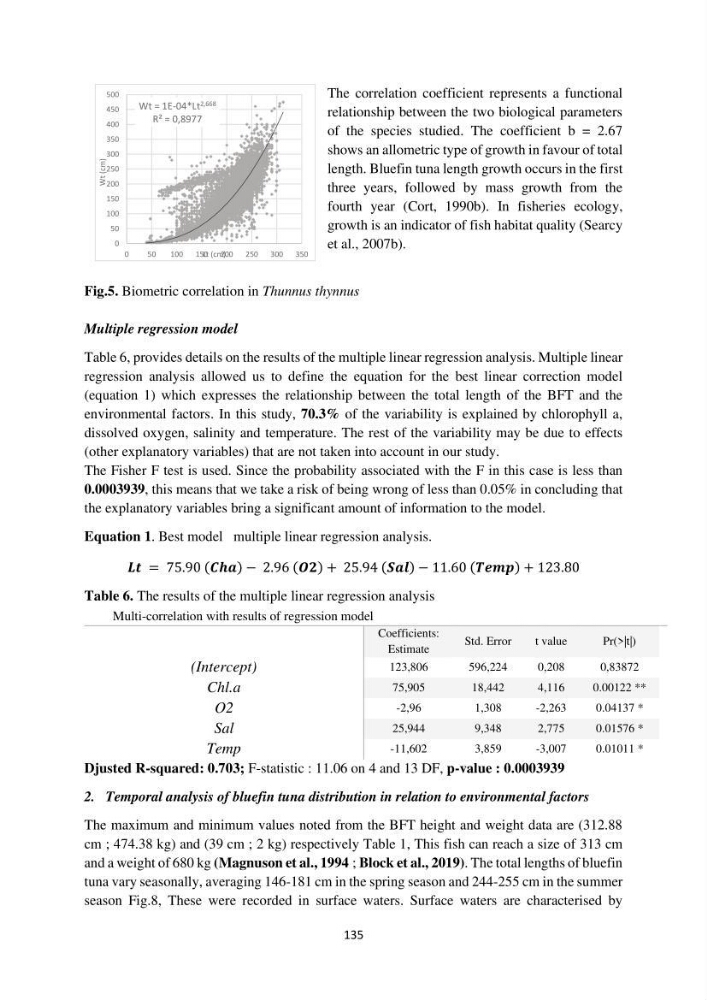
The correlation coefficient represents a functional
relationship between the two biological parameters
of the species studied. The coefficient b = 2.67
shows an allometric type of growth in favour of total
length. Bluefin tuna length growth occurs in the first
three years, followed by mass growth from the
fourth year (Cort, 1990b). In fisheries ecology,
growth is an indicator of fish habitat quality (Searcy
et al., 2007b).
Fig.5. Biometric correlation in Thunnus thynnus
Multiple regression model
Table 6, provides details on the results of the multiple linear regression analysis. Multiple linear
regression analysis allowed us to define the equation for the best linear correction model
(equation 1) which expresses the relationship between the total length of the BFT and the
environmental factors. In this study, 70.3% of the variability is explained by chlorophyll a,
dissolved oxygen, salinity and temperature. The rest of the variability may be due to effects
(other explanatory variables) that are not taken into account in our study.
The Fisher F test is used. Since the probability associated with the F in this case is less than
0.0003939, this means that we take a risk of being wrong of less than 0.05% in concluding that
the explanatory variables bring a significant amount of information to the model.
Equation 1. Best model multiple linear regression analysis.
í µí±³í µí² = 75.90 (í µí±ªí µí²í µí²) − 2.96 (í µí±¶í µí¿) + 25.94 (í µí±ºí µí²í µí²) − 11.60 (í µí±»í µí²í µí²í µí²) + 123.80
Table 6. The results of the multiple linear regression analysis
Djusted R-squared: 0.703; F-statistic : 11.06 on 4 and 13 DF, p-value : 0.0003939
2. Temporal analysis of bluefin tuna distribution in relation to environmental factors
The maximum and minimum values noted from the BFT height and weight data are (312.88
cm ; 474.38 kg) and (39 cm ; 2 kg) respectively Table 1, This fish can reach a size of 313 cm
and a weight of 680 kg (Magnuson et al., 1994 ; Block et al., 2019). The total lengths of bluefin
tuna vary seasonally, averaging 146-181 cm in the spring season and 244-255 cm in the summer
season Fig.8, These were recorded in surface waters. Surface waters are characterised by
Multi-correlation with results of regression model
Coefficients:
Estimate
Std. Error
t value
Pr(>|t|)
(Intercept)
123,806
596,224
0,208
0,83872
Chl.a
75,905
18,442
4,116
0.00122 **
O2
-2,96
1,308
-2,263
0.04137 *
Sal
25,944
9,348
2,775
0.01576 *
Temp
-11,602
3,859
-3,007
0.01011 *
Wt = 1E-04*Lt 2,668
R² = 0,8977
0
50
100
150
200
250
300
350
400
450
500
0
50
100
150
200
250
300
350
Wt
(cm)
Lt (cm)
The correlation coefficient represents a functional
relationship between the two biological parameters
of the species studied. The coefficient b = 2.67
shows an allometric type of growth in favour of total
length. Bluefin tuna length growth occurs in the first
three years, followed by mass growth from the
fourth year (Cort, 1990b). In fisheries ecology,
growth is an indicator of fish habitat quality (Searcy
et al., 2007b).
Fig.5. Biometric correlation in Thunnus thynnus
Multiple regression model
Table 6, provides details on the results of the multiple linear regression analysis. Multiple linear
regression analysis allowed us to define the equation for the best linear correction model
(equation 1) which expresses the relationship between the total length of the BFT and the
environmental factors. In this study, 70.3% of the variability is explained by chlorophyll a,
dissolved oxygen, salinity and temperature. The rest of the variability may be due to effects
(other explanatory variables) that are not taken into account in our study.
The Fisher F test is used. Since the probability associated with the F in this case is less than
0.0003939, this means that we take a risk of being wrong of less than 0.05% in concluding that
the explanatory variables bring a significant amount of information to the model.
Equation 1. Best model multiple linear regression analysis.
í µí±³í µí² = 75.90 (í µí±ªí µí²í µí²) − 2.96 (í µí±¶í µí¿) + 25.94 (í µí±ºí µí²í µí²) − 11.60 (í µí±»í µí²í µí²í µí²) + 123.80
Table 6. The results of the multiple linear regression analysis
Djusted R-squared: 0.703; F-statistic : 11.06 on 4 and 13 DF, p-value : 0.0003939
2. Temporal analysis of bluefin tuna distribution in relation to environmental factors
The maximum and minimum values noted from the BFT height and weight data are (312.88
cm ; 474.38 kg) and (39 cm ; 2 kg) respectively Table 1, This fish can reach a size of 313 cm
and a weight of 680 kg (Magnuson et al., 1994 ; Block et al., 2019). The total lengths of bluefin
tuna vary seasonally, averaging 146-181 cm in the spring season and 244-255 cm in the summer
season Fig.8, These were recorded in surface waters. Surface waters are characterised by
Multi-correlation with results of regression model
Coefficients:
Estimate
Std. Error
t value
Pr(>|t|)
(Intercept)
123,806
596,224
0,208
0,83872
Chl.a
75,905
18,442
4,116
0.00122 **
O2
-2,96
1,308
-2,263
0.04137 *
Sal
25,944
9,348
2,775
0.01576 *
Temp
-11,602
3,859
-3,007
0.01011 *
Wt = 1E-04*Lt 2,668
R² = 0,8977
0
50
100
150
200
250
300
350
400
450
500
0
50
100
150
200
250
300
350
Wt
(cm)
Lt (cm)