

133
Table 3. Abundances (number
of
individuals) of thunnus thynnus
by quarter
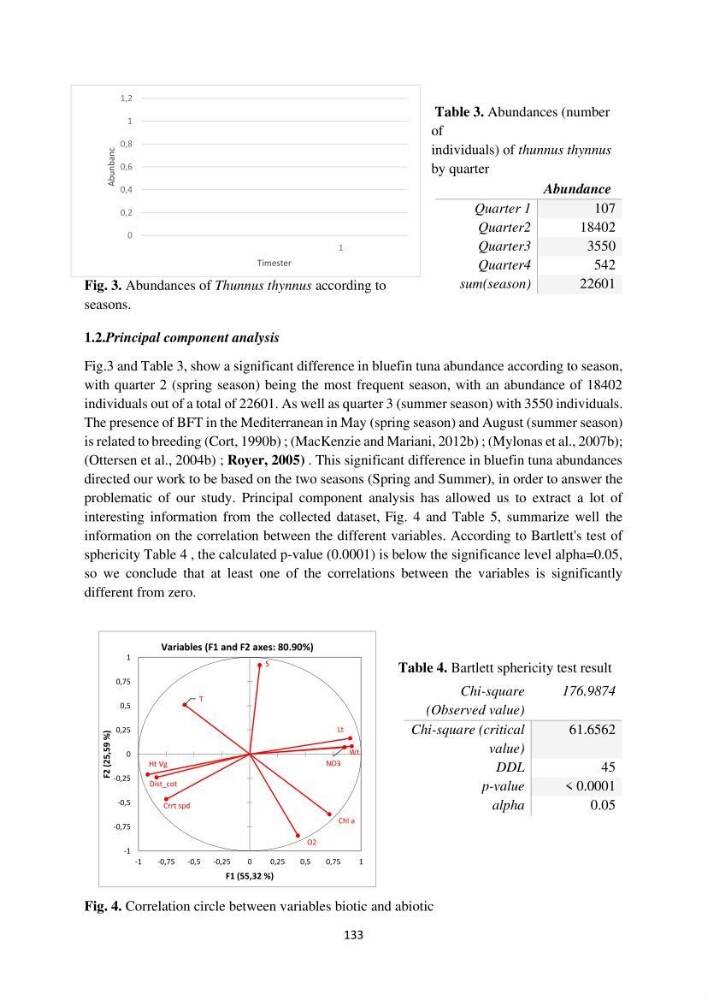
Fig. 3. Abundances of Thunnus thynnus according to
seasons.
1.2.Principal component analysis
Fig.3 and Table 3, show a significant difference in bluefin tuna abundance according to season,
with quarter 2 (spring season) being the most frequent season, with an abundance of 18402
individuals out of a total of 22601. As well as quarter 3 (summer season) with 3550 individuals.
The presence of BFT in the Mediterranean in May (spring season) and August (summer season)
is related to breeding (Cort, 1990b) ; (MacKenzie and Mariani, 2012b) ; (Mylonas et al., 2007b);
(Ottersen et al., 2004b) ; Royer, 2005) . This significant difference in bluefin tuna abundances
directed our work to be based on the two seasons (Spring and Summer), in order to answer the
problematic of our study. Principal component analysis has allowed us to extract a lot of
interesting information from the collected dataset, Fig. 4 and Table 5, summarize well the
information on the correlation between the different variables. According to Bartlett's test of
sphericity Table 4 , the calculated p-value (0.0001) is below the significance level alpha=0.05,
so we conclude that at least one of the correlations between the variables is significantly
different from zero.
Table 4. Bartlett sphericity test result
Fig. 4. Correlation circle between variables biotic and abiotic
Abundance
Quarter 1
107
Quarter2
18402
Quarter3
3550
Quarter4
542
sum(season)
22601
Chi-square
(Observed value)
176.9874
Chi-square (critical
value)
61.6562
DDL
45
p-value
< 0.0001
alpha
0.05
Lt
Wt
Chl a
NO3
O2
S
T
Crrt spd
Ht Vg
Dist_cot
-1
-0,75
-0,5
-0,25
0
0,25
0,5
0,75
1
-1
-0,75
-0,5
-0,25
0
0,25
0,5
0,75
1
F2
(25,59
%)
F1 (55,32 %)
Variables (F1 and F2 axes: 80.90%)
0
0,2
0,4
0,6
0,8
1
1,2
1
Abunbanc
Timester
Table 3. Abundances (number
of
individuals) of thunnus thynnus
by quarter
Fig. 3. Abundances of Thunnus thynnus according to
seasons.
1.2.Principal component analysis
Fig.3 and Table 3, show a significant difference in bluefin tuna abundance according to season,
with quarter 2 (spring season) being the most frequent season, with an abundance of 18402
individuals out of a total of 22601. As well as quarter 3 (summer season) with 3550 individuals.
The presence of BFT in the Mediterranean in May (spring season) and August (summer season)
is related to breeding (Cort, 1990b) ; (MacKenzie and Mariani, 2012b) ; (Mylonas et al., 2007b);
(Ottersen et al., 2004b) ; Royer, 2005) . This significant difference in bluefin tuna abundances
directed our work to be based on the two seasons (Spring and Summer), in order to answer the
problematic of our study. Principal component analysis has allowed us to extract a lot of
interesting information from the collected dataset, Fig. 4 and Table 5, summarize well the
information on the correlation between the different variables. According to Bartlett's test of
sphericity Table 4 , the calculated p-value (0.0001) is below the significance level alpha=0.05,
so we conclude that at least one of the correlations between the variables is significantly
different from zero.
Table 4. Bartlett sphericity test result
Fig. 4. Correlation circle between variables biotic and abiotic
Abundance
Quarter 1
107
Quarter2
18402
Quarter3
3550
Quarter4
542
sum(season)
22601
Chi-square
(Observed value)
176.9874
Chi-square (critical
value)
61.6562
DDL
45
p-value
< 0.0001
alpha
0.05
Lt
Wt
Chl a
NO3
O2
S
T
Crrt spd
Ht Vg
Dist_cot
-1
-0,75
-0,5
-0,25
0
0,25
0,5
0,75
1
-1
-0,75
-0,5
-0,25
0
0,25
0,5
0,75
1
F2
(25,59
%)
F1 (55,32 %)
Variables (F1 and F2 axes: 80.90%)
0
0,2
0,4
0,6
0,8
1
1,2
1
Abunbanc
Timester