

390
K. Kubiak-Wójcicka and M. Kielik
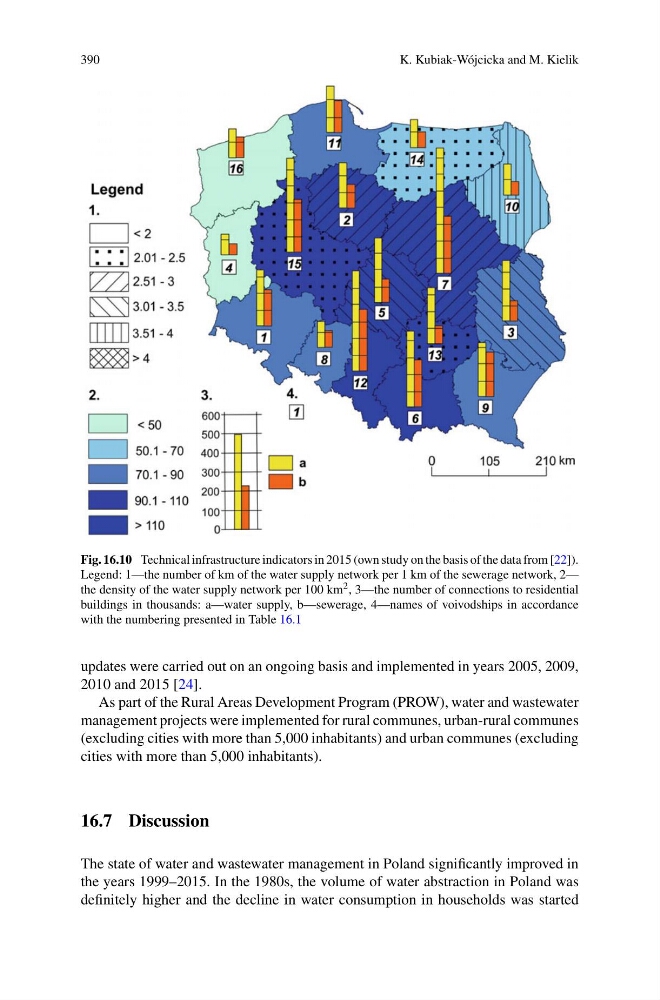
Fig. 16.10 Technical infrastructure indicators in 2015 (own study on the basis of the data from [22]).
Legend: 1—the number of km of the water supply network per 1 km of the sewerage network, 2—
the density of the water supply network per 100 km 2 , 3—the number of connections to residential
buildings in thousands: a—water supply, b—sewerage, 4—names of voivodships in accordance
with the numbering presented in Table 16.1
updates were carried out on an ongoing basis and implemented in years 2005, 2009,
2010 and 2015 [24].
As part of the Rural Areas Development Program (PROW), water and wastewater
management projects were implemented for rural communes, urban-rural communes
(excluding cities with more than 5,000 inhabitants) and urban communes (excluding
cities with more than 5,000 inhabitants).
16.7 Discussion
The state of water and wastewater management in Poland significantly improved in
the years 1999–2015. In the 1980s, the volume of water abstraction in Poland was
definitely higher and the decline in water consumption in households was started
K. Kubiak-Wójcicka and M. Kielik
Fig. 16.10 Technical infrastructure indicators in 2015 (own study on the basis of the data from [22]).
Legend: 1—the number of km of the water supply network per 1 km of the sewerage network, 2—
the density of the water supply network per 100 km 2 , 3—the number of connections to residential
buildings in thousands: a—water supply, b—sewerage, 4—names of voivodships in accordance
with the numbering presented in Table 16.1
updates were carried out on an ongoing basis and implemented in years 2005, 2009,
2010 and 2015 [24].
As part of the Rural Areas Development Program (PROW), water and wastewater
management projects were implemented for rural communes, urban-rural communes
(excluding cities with more than 5,000 inhabitants) and urban communes (excluding
cities with more than 5,000 inhabitants).
16.7 Discussion
The state of water and wastewater management in Poland significantly improved in
the years 1999–2015. In the 1980s, the volume of water abstraction in Poland was
definitely higher and the decline in water consumption in households was started