

388
K. Kubiak-Wójcicka and M. Kielik
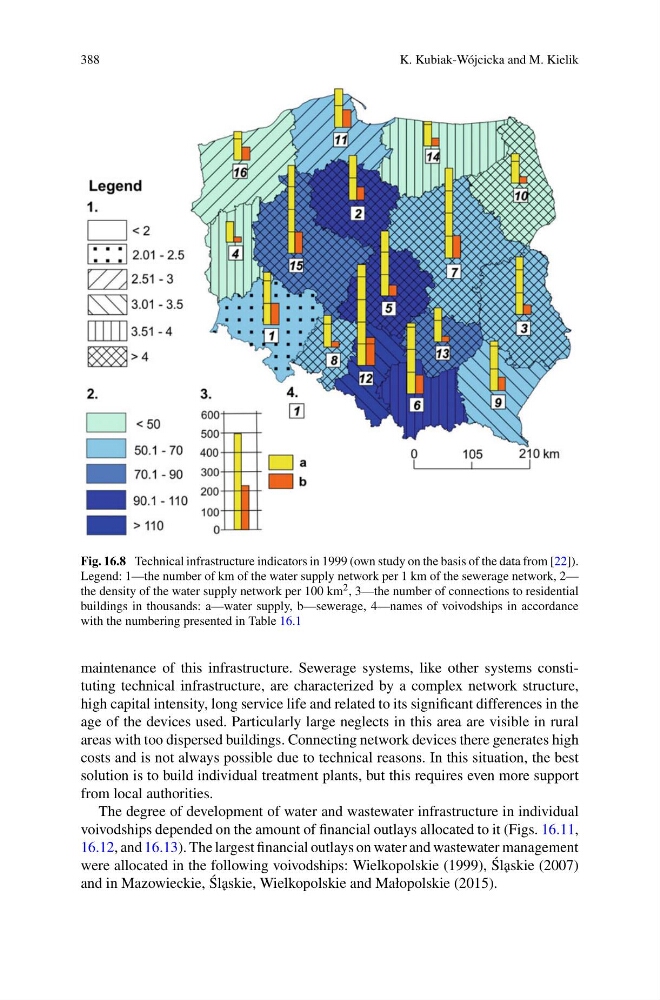
Fig. 16.8 Technical infrastructure indicators in 1999 (own study on the basis of the data from [22]).
Legend: 1—the number of km of the water supply network per 1 km of the sewerage network, 2—
the density of the water supply network per 100 km 2 , 3—the number of connections to residential
buildings in thousands: a—water supply, b—sewerage, 4—names of voivodships in accordance
with the numbering presented in Table 16.1
maintenance of this infrastructure. Sewerage systems, like other systems constituting technical infrastructure, are characterized by a complex network structure,
high capital intensity, long service life and related to its significant differences in the
age of the devices used. Particularly large neglects in this area are visible in rural
areas with too dispersed buildings. Connecting network devices there generates high
costs and is not always possible due to technical reasons. In this situation, the best
solution is to build individual treatment plants, but this requires even more support
from local authorities.
The degree of development of water and wastewater infrastructure in individual
voivodships depended on the amount of financial outlays allocated to it (Figs. 16.11,
16.12, and 16.13). The largest financial outlays on water and wastewater management
were allocated in the following voivodships: Wielkopolskie (1999), ´
Sl˛ askie (2007)
and in Mazowieckie, ´
Sl˛ askie, Wielkopolskie and Małopolskie (2015).
K. Kubiak-Wójcicka and M. Kielik
Fig. 16.8 Technical infrastructure indicators in 1999 (own study on the basis of the data from [22]).
Legend: 1—the number of km of the water supply network per 1 km of the sewerage network, 2—
the density of the water supply network per 100 km 2 , 3—the number of connections to residential
buildings in thousands: a—water supply, b—sewerage, 4—names of voivodships in accordance
with the numbering presented in Table 16.1
maintenance of this infrastructure. Sewerage systems, like other systems constituting technical infrastructure, are characterized by a complex network structure,
high capital intensity, long service life and related to its significant differences in the
age of the devices used. Particularly large neglects in this area are visible in rural
areas with too dispersed buildings. Connecting network devices there generates high
costs and is not always possible due to technical reasons. In this situation, the best
solution is to build individual treatment plants, but this requires even more support
from local authorities.
The degree of development of water and wastewater infrastructure in individual
voivodships depended on the amount of financial outlays allocated to it (Figs. 16.11,
16.12, and 16.13). The largest financial outlays on water and wastewater management
were allocated in the following voivodships: Wielkopolskie (1999), ´
Sl˛ askie (2007)
and in Mazowieckie, ´
Sl˛ askie, Wielkopolskie and Małopolskie (2015).