

16 The State of Water and Sewage …
387
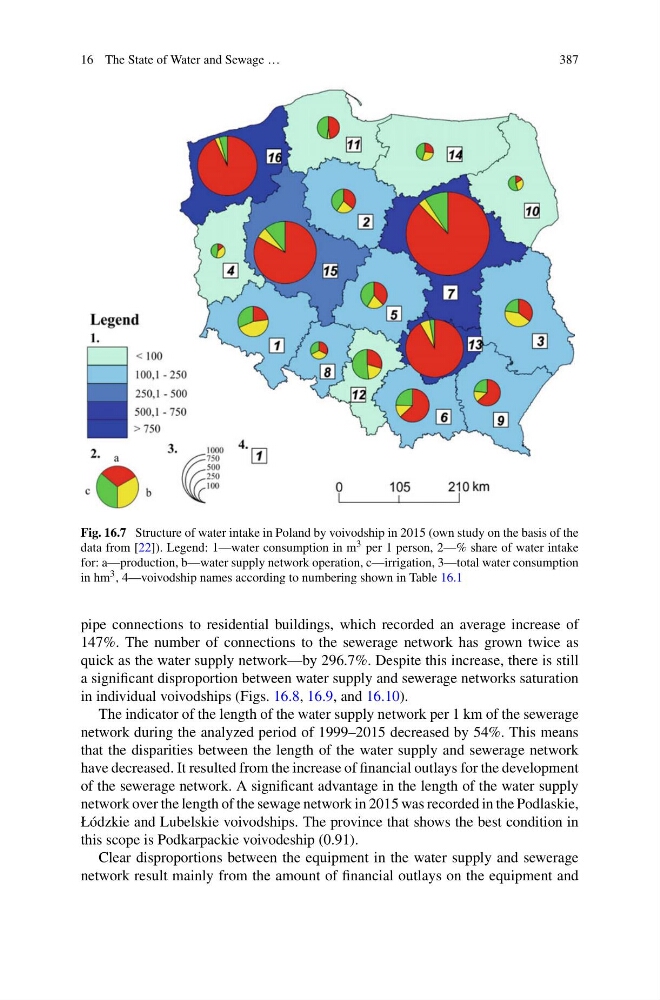
Fig. 16.7 Structure of water intake in Poland by voivodship in 2015 (own study on the basis of the
data from [22]). Legend: 1—water consumption in m 3 per 1 person, 2—% share of water intake
for: a—production, b—water supply network operation, c—irrigation, 3—total water consumption
in hm 3 , 4—voivodship names according to numbering shown in Table 16.1
pipe connections to residential buildings, which recorded an average increase of
147%. The number of connections to the sewerage network has grown twice as
quick as the water supply network—by 296.7%. Despite this increase, there is still
a significant disproportion between water supply and sewerage networks saturation
in individual voivodships (Figs. 16.8, 16.9, and 16.10).
The indicator of the length of the water supply network per 1 km of the sewerage
network during the analyzed period of 1999–2015 decreased by 54%. This means
that the disparities between the length of the water supply and sewerage network
have decreased. It resulted from the increase of financial outlays for the development
of the sewerage network. A significant advantage in the length of the water supply
network over the length of the sewage network in 2015 was recorded in the Podlaskie,
Łódzkie and Lubelskie voivodships. The province that shows the best condition in
this scope is Podkarpackie voivodeship (0.91).
Clear disproportions between the equipment in the water supply and sewerage
network result mainly from the amount of financial outlays on the equipment and
387
Fig. 16.7 Structure of water intake in Poland by voivodship in 2015 (own study on the basis of the
data from [22]). Legend: 1—water consumption in m 3 per 1 person, 2—% share of water intake
for: a—production, b—water supply network operation, c—irrigation, 3—total water consumption
in hm 3 , 4—voivodship names according to numbering shown in Table 16.1
pipe connections to residential buildings, which recorded an average increase of
147%. The number of connections to the sewerage network has grown twice as
quick as the water supply network—by 296.7%. Despite this increase, there is still
a significant disproportion between water supply and sewerage networks saturation
in individual voivodships (Figs. 16.8, 16.9, and 16.10).
The indicator of the length of the water supply network per 1 km of the sewerage
network during the analyzed period of 1999–2015 decreased by 54%. This means
that the disparities between the length of the water supply and sewerage network
have decreased. It resulted from the increase of financial outlays for the development
of the sewerage network. A significant advantage in the length of the water supply
network over the length of the sewage network in 2015 was recorded in the Podlaskie,
Łódzkie and Lubelskie voivodships. The province that shows the best condition in
this scope is Podkarpackie voivodeship (0.91).
Clear disproportions between the equipment in the water supply and sewerage
network result mainly from the amount of financial outlays on the equipment and