

16 The State of Water and Sewage …
381
0
400
800
1200
1600
2000
2400
1999
2000
2001
2002
2003
2004
2005
2006
2007
2008
2009
2010
2011
2012
2013
2014
2015
runoff in m3 per capita
water intake in m3 per capita
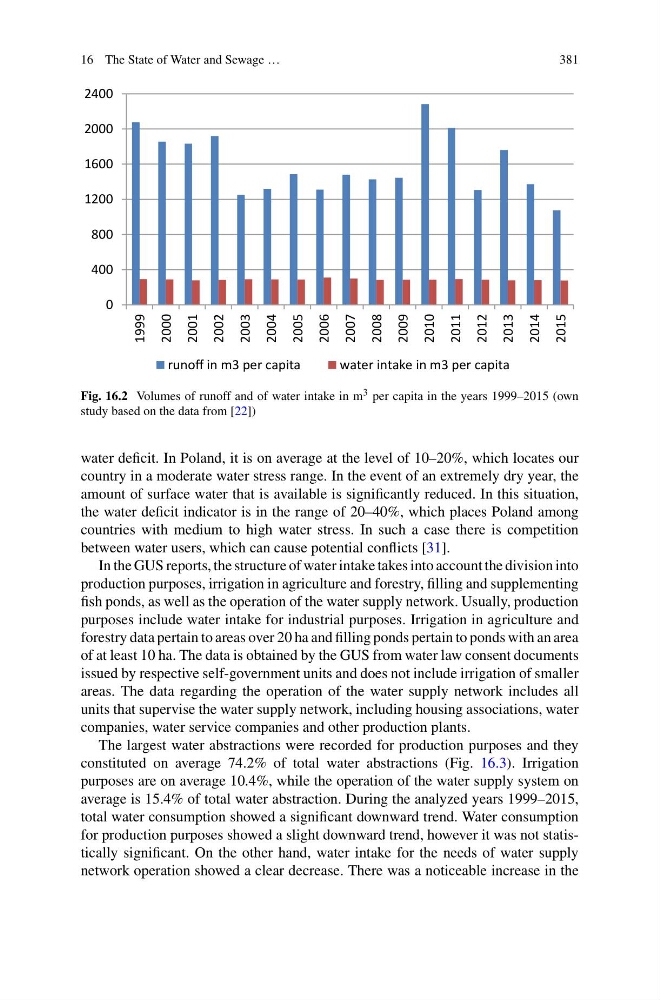
Fig. 16.2 Volumes of runoff and of water intake in m 3 per capita in the years 1999–2015 (own
study based on the data from [22])
water deficit. In Poland, it is on average at the level of 10–20%, which locates our
country in a moderate water stress range. In the event of an extremely dry year, the
amount of surface water that is available is significantly reduced. In this situation,
the water deficit indicator is in the range of 20–40%, which places Poland among
countries with medium to high water stress. In such a case there is competition
between water users, which can cause potential conflicts [31].
In the GUS reports, the structure of water intake takes into account the division into
production purposes, irrigation in agriculture and forestry, filling and supplementing
fish ponds, as well as the operation of the water supply network. Usually, production
purposes include water intake for industrial purposes. Irrigation in agriculture and
forestry data pertain to areas over 20 ha and filling ponds pertain to ponds with an area
of at least 10 ha. The data is obtained by the GUS from water law consent documents
issued by respective self-government units and does not include irrigation of smaller
areas. The data regarding the operation of the water supply network includes all
units that supervise the water supply network, including housing associations, water
companies, water service companies and other production plants.
The largest water abstractions were recorded for production purposes and they
constituted on average 74.2% of total water abstractions (Fig. 16.3). Irrigation
purposes are on average 10.4%, while the operation of the water supply system on
average is 15.4% of total water abstraction. During the analyzed years 1999–2015,
total water consumption showed a significant downward trend. Water consumption
for production purposes showed a slight downward trend, however it was not statistically significant. On the other hand, water intake for the needs of water supply
network operation showed a clear decrease. There was a noticeable increase in the
381
0
400
800
1200
1600
2000
2400
1999
2000
2001
2002
2003
2004
2005
2006
2007
2008
2009
2010
2011
2012
2013
2014
2015
runoff in m3 per capita
water intake in m3 per capita
Fig. 16.2 Volumes of runoff and of water intake in m 3 per capita in the years 1999–2015 (own
study based on the data from [22])
water deficit. In Poland, it is on average at the level of 10–20%, which locates our
country in a moderate water stress range. In the event of an extremely dry year, the
amount of surface water that is available is significantly reduced. In this situation,
the water deficit indicator is in the range of 20–40%, which places Poland among
countries with medium to high water stress. In such a case there is competition
between water users, which can cause potential conflicts [31].
In the GUS reports, the structure of water intake takes into account the division into
production purposes, irrigation in agriculture and forestry, filling and supplementing
fish ponds, as well as the operation of the water supply network. Usually, production
purposes include water intake for industrial purposes. Irrigation in agriculture and
forestry data pertain to areas over 20 ha and filling ponds pertain to ponds with an area
of at least 10 ha. The data is obtained by the GUS from water law consent documents
issued by respective self-government units and does not include irrigation of smaller
areas. The data regarding the operation of the water supply network includes all
units that supervise the water supply network, including housing associations, water
companies, water service companies and other production plants.
The largest water abstractions were recorded for production purposes and they
constituted on average 74.2% of total water abstractions (Fig. 16.3). Irrigation
purposes are on average 10.4%, while the operation of the water supply system on
average is 15.4% of total water abstraction. During the analyzed years 1999–2015,
total water consumption showed a significant downward trend. Water consumption
for production purposes showed a slight downward trend, however it was not statistically significant. On the other hand, water intake for the needs of water supply
network operation showed a clear decrease. There was a noticeable increase in the