

380
K. Kubiak-Wójcicka and M. Kielik
0
2000
4000
6000
8000
10000
1999
2000
2001
2002
2003
2004
2005
2006
2007
2008
2009
2010
2011
2012
2013
2014
2015
Surface waters
Underground waters
Water from mine and building construcons drainage
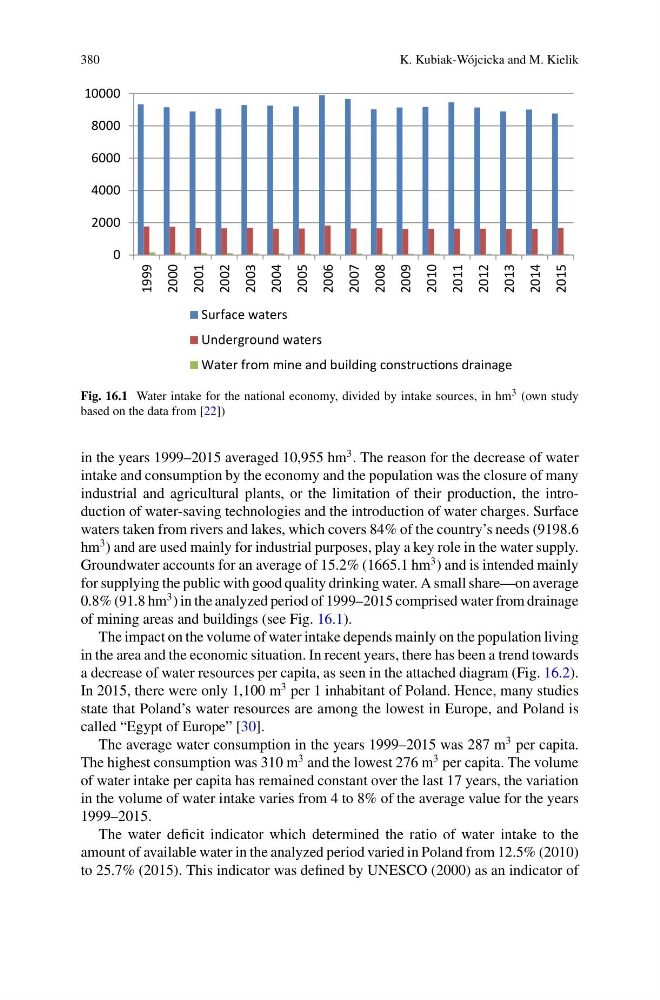
Fig. 16.1 Water intake for the national economy, divided by intake sources, in hm 3 (own study
based on the data from [22])
in the years 1999–2015 averaged 10,955 hm
3 . The reason for the decrease of water
intake and consumption by the economy and the population was the closure of many
industrial and agricultural plants, or the limitation of their production, the introduction of water-saving technologies and the introduction of water charges. Surface
waters taken from rivers and lakes, which covers 84% of the country’s needs (9198.6
hm
3 ) and are used mainly for industrial purposes, play a key role in the water supply.
Groundwater accounts for an average of 15.2% (1665.1 hm
3 ) and is intended mainly
for supplying the public with good quality drinking water. A small share—on average
0.8% (91.8 hm
3 ) in the analyzed period of 1999–2015 comprised water from drainage
of mining areas and buildings (see Fig. 16.1).
The impact on the volume of water intake depends mainly on the population living
in the area and the economic situation. In recent years, there has been a trend towards
a decrease of water resources per capita, as seen in the attached diagram (Fig. 16.2).
In 2015, there were only 1,100 m
3 per 1 inhabitant of Poland. Hence, many studies
state that Poland’s water resources are among the lowest in Europe, and Poland is
called “Egypt of Europe” [30].
The average water consumption in the years 1999–2015 was 287 m
3 per capita.
The highest consumption was 310 m
3 and the lowest 276 m
3 per capita. The volume
of water intake per capita has remained constant over the last 17 years, the variation
in the volume of water intake varies from 4 to 8% of the average value for the years
1999–2015.
The water deficit indicator which determined the ratio of water intake to the
amount of available water in the analyzed period varied in Poland from 12.5% (2010)
to 25.7% (2015). This indicator was defined by UNESCO (2000) as an indicator of
K. Kubiak-Wójcicka and M. Kielik
0
2000
4000
6000
8000
10000
1999
2000
2001
2002
2003
2004
2005
2006
2007
2008
2009
2010
2011
2012
2013
2014
2015
Surface waters
Underground waters
Water from mine and building construcons drainage
Fig. 16.1 Water intake for the national economy, divided by intake sources, in hm 3 (own study
based on the data from [22])
in the years 1999–2015 averaged 10,955 hm
3 . The reason for the decrease of water
intake and consumption by the economy and the population was the closure of many
industrial and agricultural plants, or the limitation of their production, the introduction of water-saving technologies and the introduction of water charges. Surface
waters taken from rivers and lakes, which covers 84% of the country’s needs (9198.6
hm
3 ) and are used mainly for industrial purposes, play a key role in the water supply.
Groundwater accounts for an average of 15.2% (1665.1 hm
3 ) and is intended mainly
for supplying the public with good quality drinking water. A small share—on average
0.8% (91.8 hm
3 ) in the analyzed period of 1999–2015 comprised water from drainage
of mining areas and buildings (see Fig. 16.1).
The impact on the volume of water intake depends mainly on the population living
in the area and the economic situation. In recent years, there has been a trend towards
a decrease of water resources per capita, as seen in the attached diagram (Fig. 16.2).
In 2015, there were only 1,100 m
3 per 1 inhabitant of Poland. Hence, many studies
state that Poland’s water resources are among the lowest in Europe, and Poland is
called “Egypt of Europe” [30].
The average water consumption in the years 1999–2015 was 287 m
3 per capita.
The highest consumption was 310 m
3 and the lowest 276 m
3 per capita. The volume
of water intake per capita has remained constant over the last 17 years, the variation
in the volume of water intake varies from 4 to 8% of the average value for the years
1999–2015.
The water deficit indicator which determined the ratio of water intake to the
amount of available water in the analyzed period varied in Poland from 12.5% (2010)
to 25.7% (2015). This indicator was defined by UNESCO (2000) as an indicator of