

2 Assessment of Water Resources in Poland
27
-2.0
-1.5
-1.0
-0.5
0.0
0.5
1.0
1.5
2.0
0.4
0.6
0.8
1.0
1.2
1.4
1.6
1.8
2.0
2.2
1951
1955
1959
1963
1967
1971
1975
1979
1983
1987
1991
1995
1999
2003
2007
2011
2015
∑(k-1)
k
k
∑ (k-1)
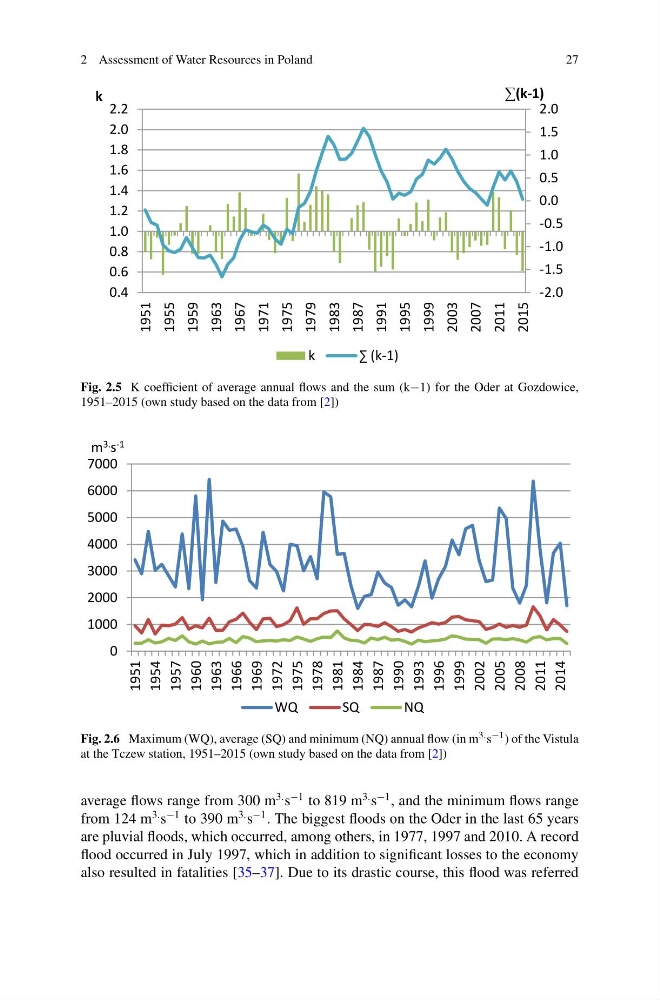
Fig. 2.5 K coefficient of average annual flows and the sum (k−1) for the Oder at Gozdowice,
1951–2015 (own study based on the data from [2])
0
1000
2000
3000
4000
5000
6000
7000
1951
1954
1957
1960
1963
1966
1969
1972
1975
1978
1981
1984
1987
1990
1993
1996
1999
2002
2005
2008
2011
2014
m 3. s -1
WQ
SQ
NQ
Fig. 2.6 Maximum (WQ), average (SQ) and minimum (NQ) annual flow (in m 3. s −1 ) of the Vistula
at the Tczew station, 1951–2015 (own study based on the data from [2])
average flows range from 300 m
3. s
−1 to 819 m
3. s
−1 , and the minimum flows range
from 124 m
3. s
−1 to 390 m
3. s
−1 . The biggest floods on the Oder in the last 65 years
are pluvial floods, which occurred, among others, in 1977, 1997 and 2010. A record
flood occurred in July 1997, which in addition to significant losses to the economy
also resulted in fatalities [35–37]. Due to its drastic course, this flood was referred
27
-2.0
-1.5
-1.0
-0.5
0.0
0.5
1.0
1.5
2.0
0.4
0.6
0.8
1.0
1.2
1.4
1.6
1.8
2.0
2.2
1951
1955
1959
1963
1967
1971
1975
1979
1983
1987
1991
1995
1999
2003
2007
2011
2015
∑(k-1)
k
k
∑ (k-1)
Fig. 2.5 K coefficient of average annual flows and the sum (k−1) for the Oder at Gozdowice,
1951–2015 (own study based on the data from [2])
0
1000
2000
3000
4000
5000
6000
7000
1951
1954
1957
1960
1963
1966
1969
1972
1975
1978
1981
1984
1987
1990
1993
1996
1999
2002
2005
2008
2011
2014
m 3. s -1
WQ
SQ
NQ
Fig. 2.6 Maximum (WQ), average (SQ) and minimum (NQ) annual flow (in m 3. s −1 ) of the Vistula
at the Tczew station, 1951–2015 (own study based on the data from [2])
average flows range from 300 m
3. s
−1 to 819 m
3. s
−1 , and the minimum flows range
from 124 m
3. s
−1 to 390 m
3. s
−1 . The biggest floods on the Oder in the last 65 years
are pluvial floods, which occurred, among others, in 1977, 1997 and 2010. A record
flood occurred in July 1997, which in addition to significant losses to the economy
also resulted in fatalities [35–37]. Due to its drastic course, this flood was referred