

28
K. Kubiak-Wójcicka
0
500
1000
1500
2000
2500
3000
3500
1951
1954
1957
1960
1963
1966
1969
1972
1975
1978
1981
1984
1987
1990
1993
1996
1999
2002
2005
2008
2011
2014
m 3. s -1
WQ
SQ
NQ
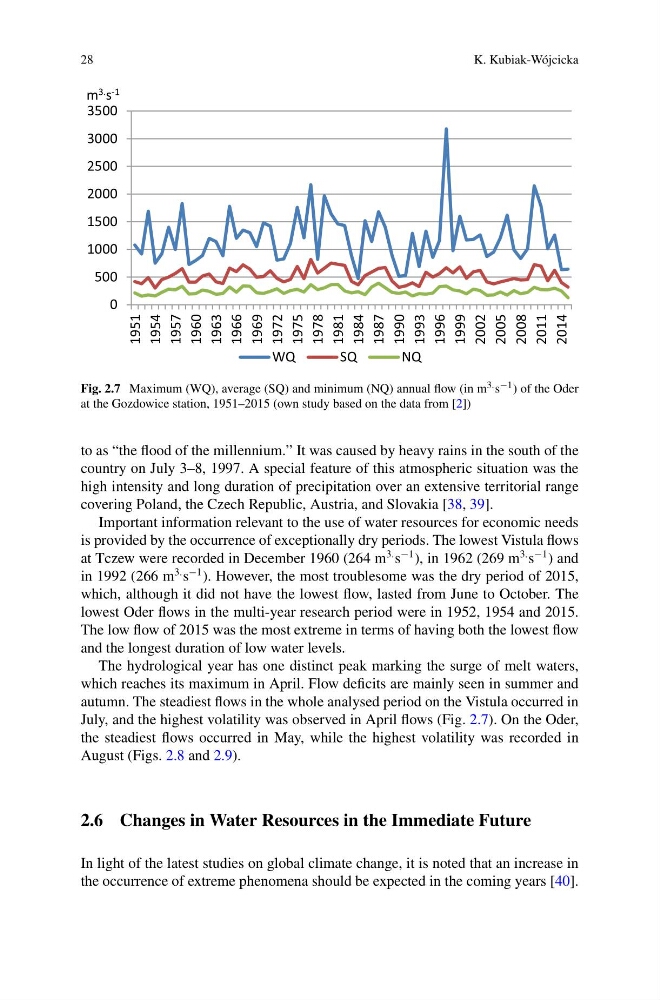
Fig. 2.7 Maximum (WQ), average (SQ) and minimum (NQ) annual flow (in m 3. s −1 ) of the Oder
at the Gozdowice station, 1951–2015 (own study based on the data from [2])
to as “the flood of the millennium.” It was caused by heavy rains in the south of the
country on July 3–8, 1997. A special feature of this atmospheric situation was the
high intensity and long duration of precipitation over an extensive territorial range
covering Poland, the Czech Republic, Austria, and Slovakia [38, 39].
Important information relevant to the use of water resources for economic needs
is provided by the occurrence of exceptionally dry periods. The lowest Vistula flows
at Tczew were recorded in December 1960 (264 m
3. s
−1 ), in 1962 (269 m
3. s
−1 ) and
in 1992 (266 m
3. s
−1 ). However, the most troublesome was the dry period of 2015,
which, although it did not have the lowest flow, lasted from June to October. The
lowest Oder flows in the multi-year research period were in 1952, 1954 and 2015.
The low flow of 2015 was the most extreme in terms of having both the lowest flow
and the longest duration of low water levels.
The hydrological year has one distinct peak marking the surge of melt waters,
which reaches its maximum in April. Flow deficits are mainly seen in summer and
autumn. The steadiest flows in the whole analysed period on the Vistula occurred in
July, and the highest volatility was observed in April flows (Fig. 2.7). On the Oder,
the steadiest flows occurred in May, while the highest volatility was recorded in
August (Figs. 2.8 and 2.9).
2.6 Changes in Water Resources in the Immediate Future
In light of the latest studies on global climate change, it is noted that an increase in
the occurrence of extreme phenomena should be expected in the coming years [40].
K. Kubiak-Wójcicka
0
500
1000
1500
2000
2500
3000
3500
1951
1954
1957
1960
1963
1966
1969
1972
1975
1978
1981
1984
1987
1990
1993
1996
1999
2002
2005
2008
2011
2014
m 3. s -1
WQ
SQ
NQ
Fig. 2.7 Maximum (WQ), average (SQ) and minimum (NQ) annual flow (in m 3. s −1 ) of the Oder
at the Gozdowice station, 1951–2015 (own study based on the data from [2])
to as “the flood of the millennium.” It was caused by heavy rains in the south of the
country on July 3–8, 1997. A special feature of this atmospheric situation was the
high intensity and long duration of precipitation over an extensive territorial range
covering Poland, the Czech Republic, Austria, and Slovakia [38, 39].
Important information relevant to the use of water resources for economic needs
is provided by the occurrence of exceptionally dry periods. The lowest Vistula flows
at Tczew were recorded in December 1960 (264 m
3. s
−1 ), in 1962 (269 m
3. s
−1 ) and
in 1992 (266 m
3. s
−1 ). However, the most troublesome was the dry period of 2015,
which, although it did not have the lowest flow, lasted from June to October. The
lowest Oder flows in the multi-year research period were in 1952, 1954 and 2015.
The low flow of 2015 was the most extreme in terms of having both the lowest flow
and the longest duration of low water levels.
The hydrological year has one distinct peak marking the surge of melt waters,
which reaches its maximum in April. Flow deficits are mainly seen in summer and
autumn. The steadiest flows in the whole analysed period on the Vistula occurred in
July, and the highest volatility was observed in April flows (Fig. 2.7). On the Oder,
the steadiest flows occurred in May, while the highest volatility was recorded in
August (Figs. 2.8 and 2.9).
2.6 Changes in Water Resources in the Immediate Future
In light of the latest studies on global climate change, it is noted that an increase in
the occurrence of extreme phenomena should be expected in the coming years [40].