

26
K. Kubiak-Wójcicka
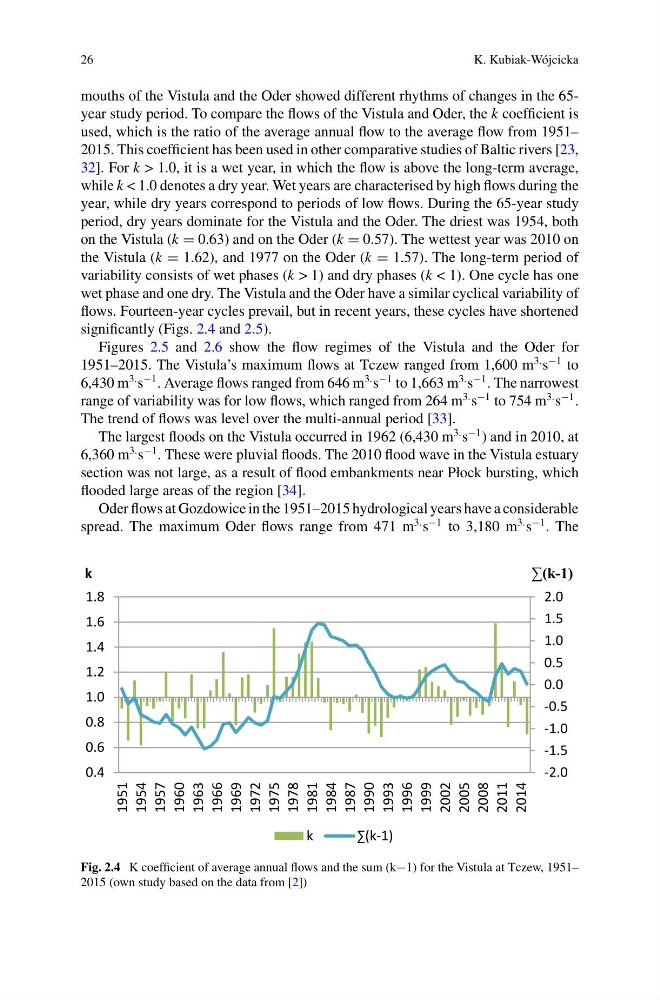
mouths of the Vistula and the Oder showed different rhythms of changes in the 65year study period. To compare the flows of the Vistula and Oder, the k coefficient is
used, which is the ratio of the average annual flow to the average flow from 1951–
2015. This coefficient has been used in other comparative studies of Baltic rivers [23,
32]. For k > 1.0, it is a wet year, in which the flow is above the long-term average,
while k < 1.0 denotes a dry year. Wet years are characterised by high flows during the
year, while dry years correspond to periods of low flows. During the 65-year study
period, dry years dominate for the Vistula and the Oder. The driest was 1954, both
on the Vistula (k = 0.63) and on the Oder (k = 0.57). The wettest year was 2010 on
the Vistula (k = 1.62), and 1977 on the Oder (k = 1.57). The long-term period of
variability consists of wet phases (k > 1) and dry phases (k < 1). One cycle has one
wet phase and one dry. The Vistula and the Oder have a similar cyclical variability of
flows. Fourteen-year cycles prevail, but in recent years, these cycles have shortened
significantly (Figs. 2.4 and 2.5).
Figures 2.5 and 2.6 show the flow regimes of the Vistula and the Oder for
1951–2015. The Vistula’s maximum flows at Tczew ranged from 1,600 m
3. s
−1 to
6,430 m
3. s
−1 . Average flows ranged from 646 m
3. s
−1 to 1,663 m
3. s
−1 . The narrowest
range of variability was for low flows, which ranged from 264 m
3. s
−1 to 754 m
3. s
−1 .
The trend of flows was level over the multi-annual period [33].
The largest floods on the Vistula occurred in 1962 (6,430 m
3. s
−1 ) and in 2010, at
6,360 m
3. s
−1 . These were pluvial floods. The 2010 flood wave in the Vistula estuary
section was not large, as a result of flood embankments near Płock bursting, which
flooded large areas of the region [34].
Oder flows at Gozdowice in the 1951–2015 hydrological years have a considerable
spread. The maximum Oder flows range from 471 m
3. s
−1 to 3,180 m
3. s
−1 . The
-2.0
-1.5
-1.0
-0.5
0.0
0.5
1.0
1.5
2.0
0.4
0.6
0.8
1.0
1.2
1.4
1.6
1.8
1951
1954
1957
1960
1963
1966
1969
1972
1975
1978
1981
1984
1987
1990
1993
1996
1999
2002
2005
2008
2011
2014
∑(k-1)
k
k
∑(k-1)
Fig. 2.4 K coefficient of average annual flows and the sum (k−1) for the Vistula at Tczew, 1951–
2015 (own study based on the data from [2])
K. Kubiak-Wójcicka
mouths of the Vistula and the Oder showed different rhythms of changes in the 65year study period. To compare the flows of the Vistula and Oder, the k coefficient is
used, which is the ratio of the average annual flow to the average flow from 1951–
2015. This coefficient has been used in other comparative studies of Baltic rivers [23,
32]. For k > 1.0, it is a wet year, in which the flow is above the long-term average,
while k < 1.0 denotes a dry year. Wet years are characterised by high flows during the
year, while dry years correspond to periods of low flows. During the 65-year study
period, dry years dominate for the Vistula and the Oder. The driest was 1954, both
on the Vistula (k = 0.63) and on the Oder (k = 0.57). The wettest year was 2010 on
the Vistula (k = 1.62), and 1977 on the Oder (k = 1.57). The long-term period of
variability consists of wet phases (k > 1) and dry phases (k < 1). One cycle has one
wet phase and one dry. The Vistula and the Oder have a similar cyclical variability of
flows. Fourteen-year cycles prevail, but in recent years, these cycles have shortened
significantly (Figs. 2.4 and 2.5).
Figures 2.5 and 2.6 show the flow regimes of the Vistula and the Oder for
1951–2015. The Vistula’s maximum flows at Tczew ranged from 1,600 m
3. s
−1 to
6,430 m
3. s
−1 . Average flows ranged from 646 m
3. s
−1 to 1,663 m
3. s
−1 . The narrowest
range of variability was for low flows, which ranged from 264 m
3. s
−1 to 754 m
3. s
−1 .
The trend of flows was level over the multi-annual period [33].
The largest floods on the Vistula occurred in 1962 (6,430 m
3. s
−1 ) and in 2010, at
6,360 m
3. s
−1 . These were pluvial floods. The 2010 flood wave in the Vistula estuary
section was not large, as a result of flood embankments near Płock bursting, which
flooded large areas of the region [34].
Oder flows at Gozdowice in the 1951–2015 hydrological years have a considerable
spread. The maximum Oder flows range from 471 m
3. s
−1 to 3,180 m
3. s
−1 . The
-2.0
-1.5
-1.0
-0.5
0.0
0.5
1.0
1.5
2.0
0.4
0.6
0.8
1.0
1.2
1.4
1.6
1.8
1951
1954
1957
1960
1963
1966
1969
1972
1975
1978
1981
1984
1987
1990
1993
1996
1999
2002
2005
2008
2011
2014
∑(k-1)
k
k
∑(k-1)
Fig. 2.4 K coefficient of average annual flows and the sum (k−1) for the Vistula at Tczew, 1951–
2015 (own study based on the data from [2])