

358
M. Kejna et al.
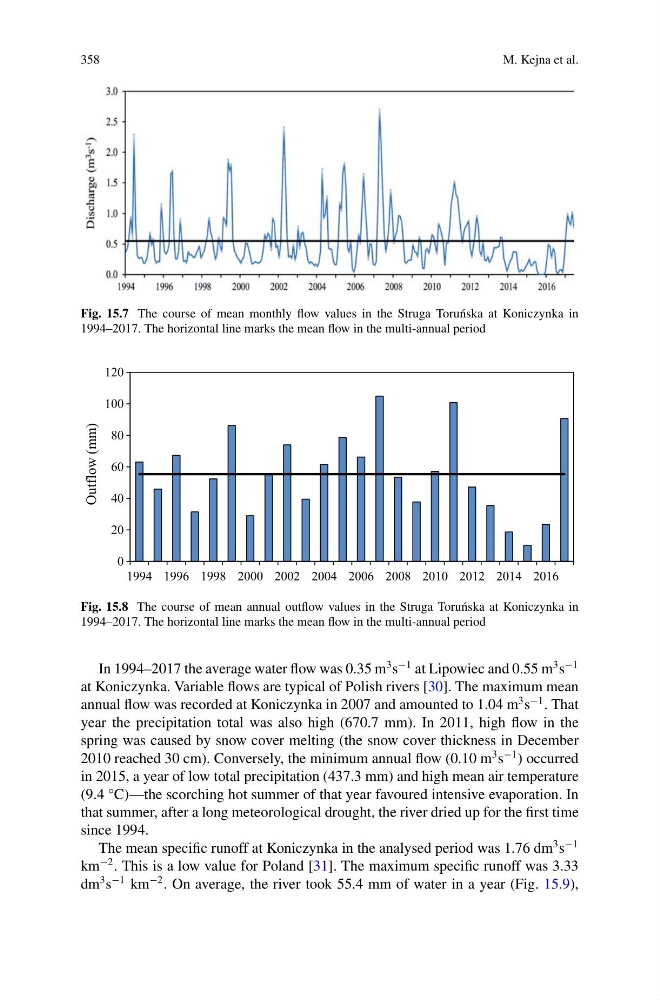
Fig. 15.7 The course of mean monthly flow values in the Struga Toru´ nska at Koniczynka in
1994–2017. The horizontal line marks the mean flow in the multi-annual period
0
20
40
60
80
100
120
1994 1996 1998 2000 2002 2004 2006 2008 2010 2012 2014 2016
Outflow (mm)
Fig. 15.8 The course of mean annual outflow values in the Struga Toru´ nska at Koniczynka in
1994–2017. The horizontal line marks the mean flow in the multi-annual period
In 1994–2017 the average water flow was 0.35 m
3 s
−1 at Lipowiec and 0.55 m
3 s
−1
at Koniczynka. Variable flows are typical of Polish rivers [30]. The maximum mean
annual flow was recorded at Koniczynka in 2007 and amounted to 1.04 m
3 s
−1 . That
year the precipitation total was also high (670.7 mm). In 2011, high flow in the
spring was caused by snow cover melting (the snow cover thickness in December
2010 reached 30 cm). Conversely, the minimum annual flow (0.10 m
3 s
−1 ) occurred
in 2015, a year of low total precipitation (437.3 mm) and high mean air temperature
(9.4 °C)—the scorching hot summer of that year favoured intensive evaporation. In
that summer, after a long meteorological drought, the river dried up for the first time
since 1994.
The mean specific runoff at Koniczynka in the analysed period was 1.76 dm
3 s
−1
km
−2 . This is a low value for Poland [31]. The maximum specific runoff was 3.33
dm
3 s
−1 km
−2 . On average, the river took 55.4 mm of water in a year (Fig. 15.9),
M. Kejna et al.
Fig. 15.7 The course of mean monthly flow values in the Struga Toru´ nska at Koniczynka in
1994–2017. The horizontal line marks the mean flow in the multi-annual period
0
20
40
60
80
100
120
1994 1996 1998 2000 2002 2004 2006 2008 2010 2012 2014 2016
Outflow (mm)
Fig. 15.8 The course of mean annual outflow values in the Struga Toru´ nska at Koniczynka in
1994–2017. The horizontal line marks the mean flow in the multi-annual period
In 1994–2017 the average water flow was 0.35 m
3 s
−1 at Lipowiec and 0.55 m
3 s
−1
at Koniczynka. Variable flows are typical of Polish rivers [30]. The maximum mean
annual flow was recorded at Koniczynka in 2007 and amounted to 1.04 m
3 s
−1 . That
year the precipitation total was also high (670.7 mm). In 2011, high flow in the
spring was caused by snow cover melting (the snow cover thickness in December
2010 reached 30 cm). Conversely, the minimum annual flow (0.10 m
3 s
−1 ) occurred
in 2015, a year of low total precipitation (437.3 mm) and high mean air temperature
(9.4 °C)—the scorching hot summer of that year favoured intensive evaporation. In
that summer, after a long meteorological drought, the river dried up for the first time
since 1994.
The mean specific runoff at Koniczynka in the analysed period was 1.76 dm
3 s
−1
km
−2 . This is a low value for Poland [31]. The maximum specific runoff was 3.33
dm
3 s
−1 km
−2 . On average, the river took 55.4 mm of water in a year (Fig. 15.9),