

340
E. Neverova-Dziopak
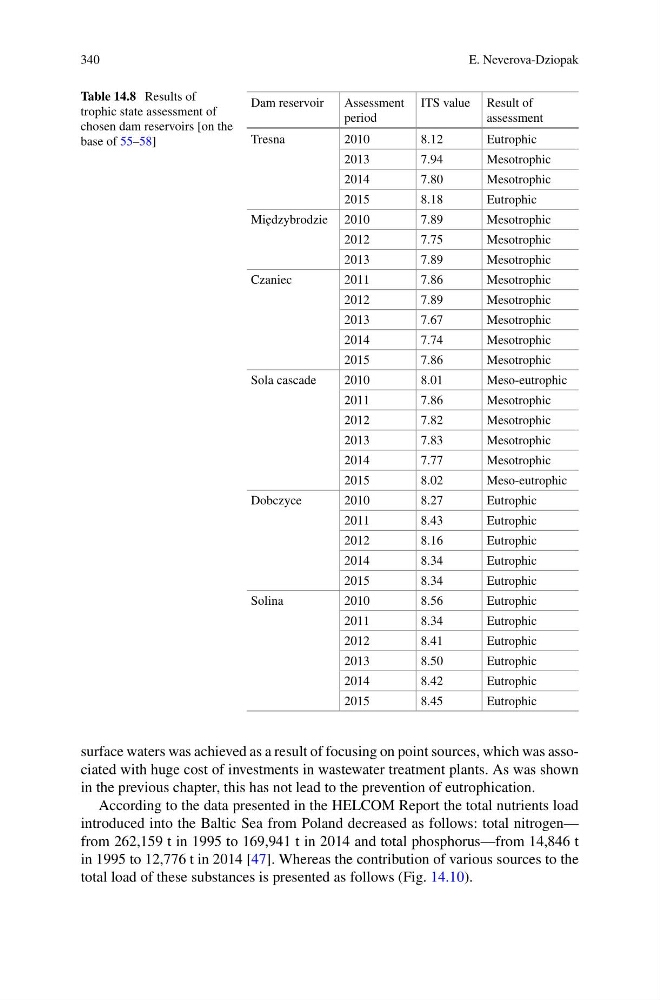
Table 14.8 Results of
trophic state assessment of
chosen dam reservoirs [on the
base of 55–58]
Dam reservoir
Assessment
period
ITS value Result of
assessment
Tresna
2010
8.12
Eutrophic
2013
7.94
Mesotrophic
2014
7.80
Mesotrophic
2015
8.18
Eutrophic
Mi˛ edzybrodzie 2010
7.89
Mesotrophic
2012
7.75
Mesotrophic
2013
7.89
Mesotrophic
Czaniec
2011
7.86
Mesotrophic
2012
7.89
Mesotrophic
2013
7.67
Mesotrophic
2014
7.74
Mesotrophic
2015
7.86
Mesotrophic
Sola cascade
2010
8.01
Meso-eutrophic
2011
7.86
Mesotrophic
2012
7.82
Mesotrophic
2013
7.83
Mesotrophic
2014
7.77
Mesotrophic
2015
8.02
Meso-eutrophic
Dobczyce
2010
8.27
Eutrophic
2011
8.43
Eutrophic
2012
8.16
Eutrophic
2014
8.34
Eutrophic
2015
8.34
Eutrophic
Solina
2010
8.56
Eutrophic
2011
8.34
Eutrophic
2012
8.41
Eutrophic
2013
8.50
Eutrophic
2014
8.42
Eutrophic
2015
8.45
Eutrophic
surface waters was achieved as a result of focusing on point sources, which was associated with huge cost of investments in wastewater treatment plants. As was shown
in the previous chapter, this has not lead to the prevention of eutrophication.
According to the data presented in the HELCOM Report the total nutrients load
introduced into the Baltic Sea from Poland decreased as follows: total nitrogen—
from 262,159 t in 1995 to 169,941 t in 2014 and total phosphorus—from 14,846 t
in 1995 to 12,776 t in 2014 [47]. Whereas the contribution of various sources to the
total load of these substances is presented as follows (Fig. 14.10).
E. Neverova-Dziopak
Table 14.8 Results of
trophic state assessment of
chosen dam reservoirs [on the
base of 55–58]
Dam reservoir
Assessment
period
ITS value Result of
assessment
Tresna
2010
8.12
Eutrophic
2013
7.94
Mesotrophic
2014
7.80
Mesotrophic
2015
8.18
Eutrophic
Mi˛ edzybrodzie 2010
7.89
Mesotrophic
2012
7.75
Mesotrophic
2013
7.89
Mesotrophic
Czaniec
2011
7.86
Mesotrophic
2012
7.89
Mesotrophic
2013
7.67
Mesotrophic
2014
7.74
Mesotrophic
2015
7.86
Mesotrophic
Sola cascade
2010
8.01
Meso-eutrophic
2011
7.86
Mesotrophic
2012
7.82
Mesotrophic
2013
7.83
Mesotrophic
2014
7.77
Mesotrophic
2015
8.02
Meso-eutrophic
Dobczyce
2010
8.27
Eutrophic
2011
8.43
Eutrophic
2012
8.16
Eutrophic
2014
8.34
Eutrophic
2015
8.34
Eutrophic
Solina
2010
8.56
Eutrophic
2011
8.34
Eutrophic
2012
8.41
Eutrophic
2013
8.50
Eutrophic
2014
8.42
Eutrophic
2015
8.45
Eutrophic
surface waters was achieved as a result of focusing on point sources, which was associated with huge cost of investments in wastewater treatment plants. As was shown
in the previous chapter, this has not lead to the prevention of eutrophication.
According to the data presented in the HELCOM Report the total nutrients load
introduced into the Baltic Sea from Poland decreased as follows: total nitrogen—
from 262,159 t in 1995 to 169,941 t in 2014 and total phosphorus—from 14,846 t
in 1995 to 12,776 t in 2014 [47]. Whereas the contribution of various sources to the
total load of these substances is presented as follows (Fig. 14.10).